\n
## Density Plot: Similarity to MSCOCO
### Overview
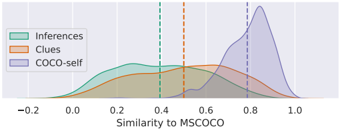
The image presents a density plot illustrating the similarity to MSCOCO for three different categories: Inferences, Clues, and COCO-self. The x-axis represents the similarity score, ranging from -0.2 to 1.0. The plot uses shaded areas to represent the density distribution of similarity scores for each category. Vertical dashed lines mark specific similarity values for each category.
### Components/Axes
* **X-axis Title:** "Similarity to MSCOCO"
* **Y-axis:** No explicit y-axis label is present, but it represents density or probability.
* **Legend:** Located in the top-left corner, with the following entries:
* "Inferences" (Light Green)
* "Clues" (Burnt Sienna)
* "COCO-self" (Lavender)
* **Vertical Dashed Lines:** Three vertical dashed lines are present, one for each category, indicating a specific similarity value.
### Detailed Analysis
The plot shows the distribution of similarity scores for each category.
* **Inferences (Light Green):** The density distribution for "Inferences" starts at approximately -0.2, rises to a peak around 0.3, and then declines towards 0. The vertical dashed line for "Inferences" is located at approximately 0.4.
* **Clues (Burnt Sienna):** The density distribution for "Clues" begins around 0.0, increases to a peak around 0.5, and then decreases. The vertical dashed line for "Clues" is located at approximately 0.6.
* **COCO-self (Lavender):** The density distribution for "COCO-self" starts around 0.6, rises sharply to a peak around 0.85, and then declines. The vertical dashed line for "COCO-self" is located at approximately 0.8.
The distributions overlap significantly, particularly between "Clues" and "COCO-self" in the range of 0.6 to 0.8. "Inferences" has a lower overall similarity score compared to the other two categories.
### Key Observations
* "COCO-self" consistently exhibits the highest similarity to MSCOCO, with the majority of its distribution concentrated above 0.7.
* "Clues" shows a broader distribution than "COCO-self", indicating more variability in similarity scores.
* "Inferences" has the lowest similarity scores, with a significant portion of the distribution below 0.4.
* The vertical dashed lines suggest a threshold or reference point for each category.
### Interpretation
The data suggests that "COCO-self" is most similar to the MSCOCO dataset, which is expected as it likely represents the dataset itself. "Clues" exhibit moderate similarity, while "Inferences" show the lowest similarity. This could indicate that the "Inferences" are derived from a different source or represent a more abstract concept compared to "Clues" and "COCO-self". The overlapping distributions between "Clues" and "COCO-self" suggest that some "Clues" may be directly related to the MSCOCO dataset, while others are more distinct. The vertical dashed lines could represent a cutoff point for considering a similarity score as significant or meaningful. The plot provides a visual comparison of the similarity between these three categories and the MSCOCO dataset, highlighting their relative relationships.