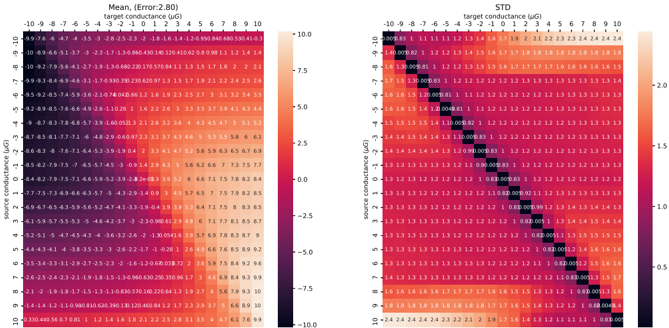
## Heatmap: Mean and Standard Deviation of Conductance
### Overview
The image presents two heatmaps side-by-side. The left heatmap displays the mean conductance values, while the right heatmap shows the standard deviation (STD) of conductance. Both heatmaps share the same axes, representing "source conductance" and "target conductance" in micro Siemens (µG). A color bar is present on the right of each heatmap to indicate the value range.
### Components/Axes
**Left Heatmap (Mean):**
* **Title:** Mean, (Error: 2.80)
* **X-axis:** target conductance (µG), ranging from -10 to 10 in integer increments.
* **Y-axis:** source conductance (µG), ranging from -10 to 10 in integer increments.
* **Color Bar:** Ranges from -10.0 (dark purple) to 10.0 (yellow). The color bar has tick marks at -10.0, -7.5, -5.0, -2.5, 0.0, 2.5, 5.0, 7.5, and 10.0.
**Right Heatmap (STD):**
* **Title:** STD
* **X-axis:** target conductance (µG), ranging from -10 to 10 in integer increments.
* **Y-axis:** source conductance (µG), ranging from -10 to 10 in integer increments.
* **Color Bar:** Ranges from 0.0 (dark purple) to 2.0 (yellow). The color bar has tick marks at 0.0, 0.5, 1.0, 1.5, and 2.0.
### Detailed Analysis
**Left Heatmap (Mean):**
The mean conductance values vary significantly across the heatmap.
* **Trend:** The values generally increase as both the source and target conductance increase. The lower-left corner (negative source and target conductance) shows the lowest values (around -9 to -4), while the upper-right corner (positive source and target conductance) shows the highest values (around 0.3 to 10).
* **Specific Values:**
* (-10, -10): -9.9
* (10, -10): -1.4
* (-10, 10): 0.3
* (10, 10): 9.9
* (0, 0): -0.0033
**Right Heatmap (STD):**
The standard deviation values are concentrated along the diagonal of the heatmap.
* **Trend:** The highest STD values are along the diagonal where source conductance equals target conductance. The values decrease as you move away from the diagonal.
* **Specific Values:**
* (-10, -10): 0.00
* (10, 10): 0.00
* (-10, -9): 0.83
* (-9, -10): 1.4
* (0, 0): 0.00
* (10, 9): 0.001
* (9, 10): 0.001
### Key Observations
* The mean conductance values are strongly influenced by both source and target conductance.
* The standard deviation is highest when source and target conductances are equal, indicating greater variability under these conditions.
### Interpretation
The heatmaps provide insights into the relationship between source and target conductance. The mean conductance heatmap suggests a positive correlation between both parameters. The STD heatmap indicates that the system is most variable when the source and target conductances are closely matched. This could be due to the system being more sensitive or unstable under these conditions. The error value of 2.80 associated with the mean conductance suggests that the mean values have a certain level of uncertainty.