## Heatmaps: Mean Error vs. Standard Deviation of Conductance Relationships
### Overview
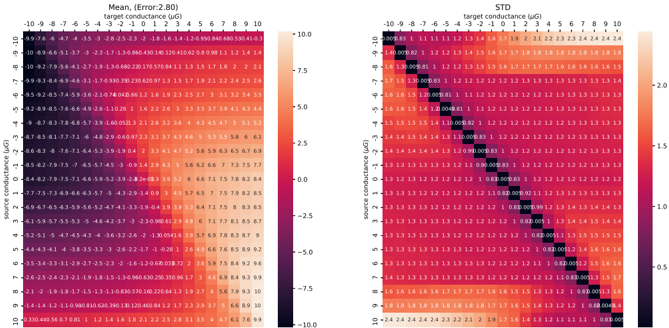
Two side-by-side heatmaps visualize relationships between target and source conductance measurements. The left heatmap shows mean error values (with ±2.80 uncertainty), while the right displays standard deviation (STD) values. Both use a color gradient from dark blue (-10.0) to bright red (10.0) to represent magnitude, with numerical values embedded in each cell.
### Components/Axes
- **X-axis (target conductance)**: Labeled "target conductance (μG)", ranges from -10 to 10 in increments of 2
- **Y-axis (source conductance)**: Labeled "source conductance (μG)", ranges from -10 to 10 in increments of 2
- **Color scale**: Gradient from dark blue (-10.0) to bright red (10.0), with legend positioned on the right
- **Legend**: Vertical color bar with numerical scale (-10.0 to 10.0) and gradient matching heatmap colors
### Detailed Analysis
**Left Heatmap (Mean Error: ±2.80):**
- Contains 11x11 grid of cells with values like "-9.97-6.4", "-10.00-0.0", and "10.00-0.0"
- Values represent mean error ranges (e.g., "-9.97-6.4" = -9.97 ± 6.4)
- Notable clusters:
- Dark blue cells (-10.0 to -5.0) in bottom-left quadrant
- Bright red cells (5.0 to 10.0) in top-right quadrant
- Diagonal band of moderate values (0.0 to 2.5) from bottom-left to top-right
**Right Heatmap (STD):**
- Similar 11x11 grid with values like "1.2", "0.8", and "0.00081"
- Values represent standard deviation magnitudes
- Notable patterns:
- Black cells (0.0) along diagonal from top-left to bottom-right
- Bright red cells (1.5 to 2.5) in upper-right quadrant
- Dark blue cells (-1.5 to -0.5) in lower-left quadrant
### Key Observations
1. **Mean Error Distribution**:
- Strong negative errors (-10.0 to -5.0) dominate when source conductance < -5 μG and target conductance < 0 μG
- Positive errors (5.0 to 10.0) concentrated when both conductances > 5 μG
- Moderate errors (0.0 to 2.5) along diagonal where source ≈ target conductance
2. **Standard Deviation Patterns**:
- Near-zero variability (black cells) along diagonal where source = target conductance
- High variability (1.5-2.5) in upper-right quadrant (high target/source conductances)
- Negative variability (-1.5 to -0.5) in lower-left quadrant (low conductances)
3. **Color Consistency**:
- All cells match legend color gradient exactly
- Dark blue cells consistently represent values < -5.0
- Bright red cells consistently represent values > 5.0
### Interpretation
The data suggests:
1. **Measurement Bias**: Systematic underestimation (negative errors) occurs when measuring low conductance values (<0 μG), while overestimation (positive errors) dominates at high conductances (>5 μG)
2. **Precision Relationship**: Measurement precision (STD) improves significantly when target and source conductances match (black diagonal), with variability increasing as the difference between conductances grows
3. **Nonlinear Relationships**: The diagonal band of moderate mean errors (0.0-2.5) suggests a zone of relative accuracy when conductances are similar but not identical
4. **Outlier Regions**: The bright red cells in upper-right (mean error >5.0) and lower-left (STD < -1.5) indicate potential measurement artifacts or calibration issues in extreme conductance ranges
These patterns highlight the importance of conductance matching for measurement accuracy and suggest potential calibration requirements for extreme conductance values.