## Flowchart: Adversarial Attack Process
### Overview
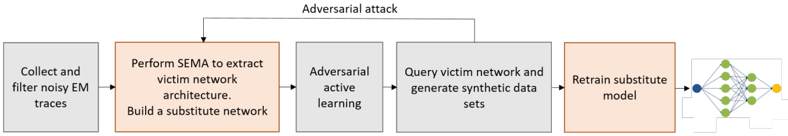
The flowchart illustrates a multi-stage adversarial attack methodology, starting with data collection and ending with a retrained substitute model. The process integrates network analysis, adversarial learning, and synthetic data generation to iteratively improve attack effectiveness.
### Components/Axes
1. **Input Phase**
- "Collect and filter noisy EM traces" (gray box, leftmost)
- "Perform SEMA to extract victim network architecture. Build a substitute network" (orange box, second from left)
2. **Adversarial Learning Phase**
- "Adversarial active learning" (gray box, third from left)
- "Query victim network and generate synthetic data sets" (gray box, fourth from left)
3. **Output Phase**
- "Retrain substitute model" (orange box, fifth from left)
- Network diagram (rightmost) showing interconnected nodes (green and yellow)
**Flow Direction**: Left-to-right progression with bidirectional feedback between "Adversarial active learning" and "Query victim network" steps.
### Detailed Analysis
- **Step 1**: Initial data preprocessing ("Collect and filter noisy EM traces") establishes the foundation for subsequent analysis.
- **Step 2**: SEMA (Structural Emulation via Machine Analysis) extracts the victim's network architecture, creating a baseline substitute model.
- **Step 3**: Adversarial active learning introduces targeted perturbations to the substitute model, likely to identify vulnerabilities.
- **Step 4**: The victim network is queried to generate synthetic datasets, which refine the attack strategy.
- **Step 5**: The substitute model is retrained using synthetic data, closing the feedback loop to enhance attack robustness.
- **Final Output**: A network diagram with green (likely benign) and yellow (critical) nodes, representing the optimized attack surface.
### Key Observations
- **Feedback Loop**: The bidirectional arrow between "Adversarial active learning" and "Query victim network" suggests iterative refinement of the attack model.
- **Color Coding**: Orange boxes denote core attack phases (SEMA, retraining), while gray boxes represent preparatory/synthetic data steps.
- **Node Significance**: The final network diagram’s yellow nodes may represent high-value targets or critical infrastructure within the victim’s architecture.
### Interpretation
This flowchart outlines a cyclical adversarial framework where:
1. **Data Collection** → **Model Extraction** → **Adversarial Refinement** → **Synthetic Data Generation** → **Model Retraining** creates a self-improving attack pipeline.
2. The use of SEMA implies a focus on reverse-engineering the victim’s network topology to identify exploitable weaknesses.
3. Adversarial active learning likely involves generating adversarial examples to stress-test the substitute model, while synthetic data generation bridges the gap between simulated and real-world attack scenarios.
4. The final network diagram’s color-coded nodes suggest prioritization of attack targets, with yellow nodes being critical for maximizing impact.
This process emphasizes iterative adversarial refinement, leveraging both real-world data and synthetic simulations to evolve attack strategies dynamically.