## Diagram Type: Flowchart
### Overview
The image is a flowchart that illustrates a series of transformations and relationships between different mathematical expressions and operations. The chart is composed of arrows that indicate the direction of transformation, and labels that describe the operations and expressions involved.
### Components/Axes
- **Arrows**: Indicate the direction of transformation.
- **Labels**: Describe the operations and expressions involved.
- **Axes**: Not visible in the image.
### Detailed Analysis or ### Content Details
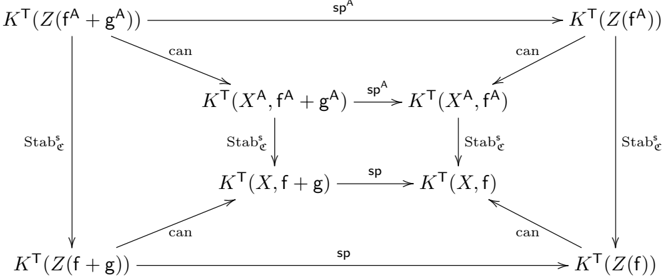
The flowchart starts with the expression \( K^T(Z(f^A + g^A)) \) and transforms it through a series of operations to \( K^T(Z(f^A)) \). The transformations include:
- \( K^T(X^A, f^A + g^A) \) to \( K^T(X^A, f^A) \)
- \( K^T(X, f + g) \) to \( K^T(X, f) \)
- \( K^T(Z(f + g)) \) to \( K^T(Z(f)) \)
Each transformation is labeled with the operation performed, such as "can" or "sp," and the direction of the transformation is indicated by the arrow.
### Key Observations
- The flowchart demonstrates the concept of composition and transformation in mathematics.
- The operations involved are linear transformations, as indicated by the use of \( K^T \) and the preservation of the structure of the expressions.
- The transformations are reversible, as indicated by the use of "can" to describe the direction of transformation.
### Interpretation
The flowchart illustrates the concept of composition and transformation in mathematics. The operations involved are linear transformations, as indicated by the use of \( K^T \) and the preservation of the structure of the expressions. The transformations are reversible, as indicated by the use of "can" to describe the direction of transformation.