## Bar Chart: Energy Comparison by Threshold
### Overview
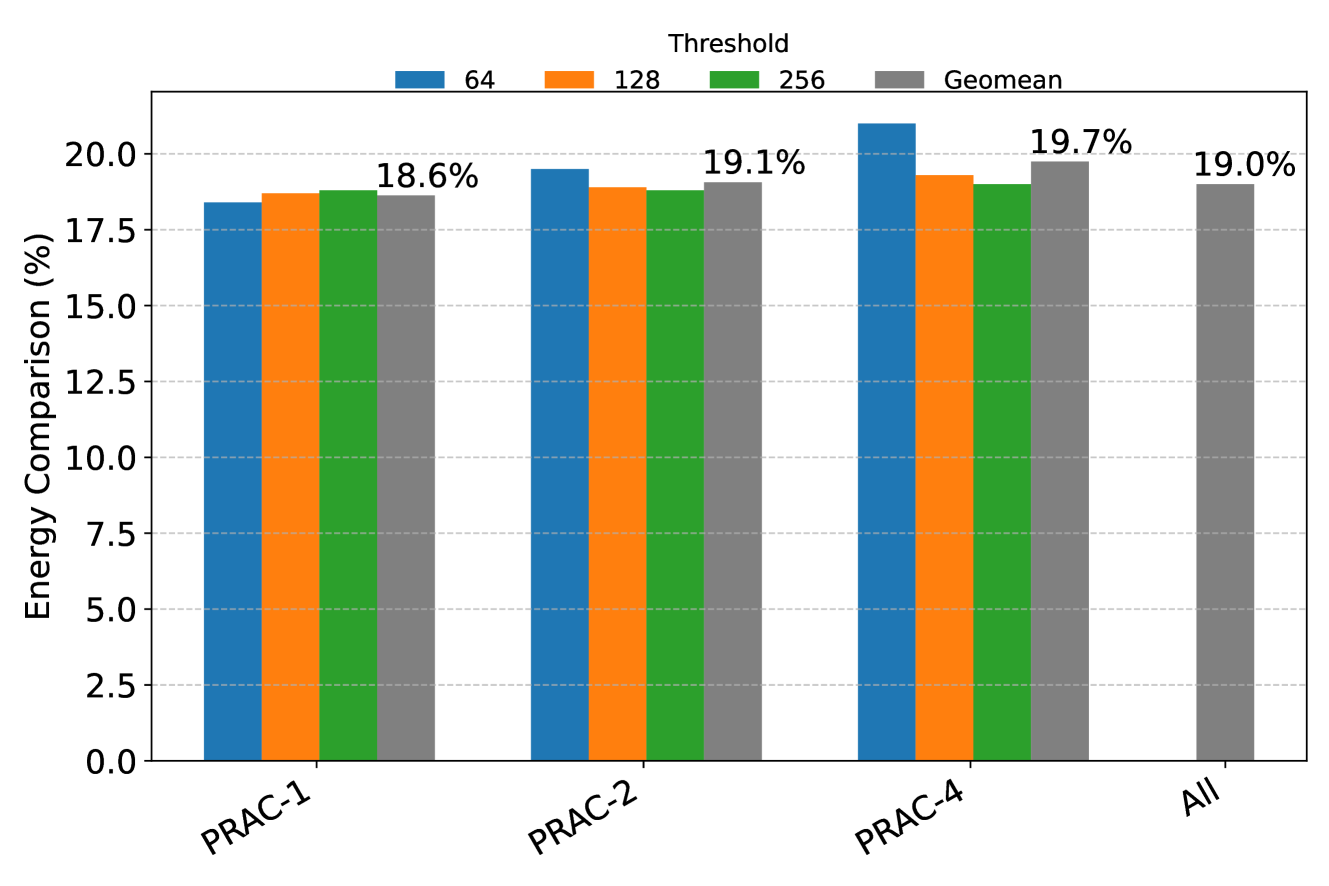
The image is a bar chart comparing energy consumption across different configurations (PRAC-1, PRAC-2, PRAC-4, and All) under varying threshold values (64, 128, 256) and their geometric mean (Geomean). The y-axis represents the energy comparison in percentage, and the x-axis represents the configurations.
### Components/Axes
* **Title:** None explicitly provided in the image.
* **X-axis:**
* Label: Categories are "PRAC-1", "PRAC-2", "PRAC-4", and "All".
* **Y-axis:**
* Label: "Energy Comparison (%)"
* Scale: Ranges from 0.0 to 20.0, with increments of 2.5.
* **Legend:** Located at the top of the chart.
* Blue: "64"
* Orange: "128"
* Green: "256"
* Gray: "Geomean"
### Detailed Analysis
Here's a breakdown of the data for each configuration and threshold:
* **PRAC-1:**
* 64 (Blue): 18.4% - 18.6%
* 128 (Orange): 18.8% - 19.0%
* 256 (Green): 18.4% - 18.8%
* Geomean (Gray): 18.6%
* **PRAC-2:**
* 64 (Blue): 19.4% - 19.6%
* 128 (Orange): 18.8% - 19.0%
* 256 (Green): 18.8% - 19.2%
* Geomean (Gray): Not explicitly labeled, but visually around 18.8% - 19.0%
* **PRAC-4:**
* 64 (Blue): 20.8% - 21.0%
* 128 (Orange): 19.2% - 19.4%
* 256 (Green): 19.4% - 19.8%
* Geomean (Gray): Not explicitly labeled, but visually around 19.6% - 19.8%
* **All:**
* Geomean (Gray): 19.0%
### Key Observations
* For PRAC-1, PRAC-2, and PRAC-4, the energy comparison values are relatively close across the different threshold values (64, 128, 256).
* The "All" configuration only has a "Geomean" value.
* PRAC-4 with a threshold of 64 shows the highest energy comparison value.
### Interpretation
The bar chart illustrates the energy efficiency of different configurations (PRAC-1, PRAC-2, PRAC-4) under varying threshold settings. The geometric mean provides a central tendency for each configuration. The data suggests that the choice of threshold can influence energy consumption, with PRAC-4 showing the highest energy comparison when the threshold is set to 64. The "All" configuration likely represents an aggregate or overall performance metric. The relatively small differences between the threshold values for each PRAC configuration suggest that the system's energy consumption is not highly sensitive to the threshold within the tested range.