# Technical Document Analysis: Energy Efficiency Comparison Chart
## Chart Type
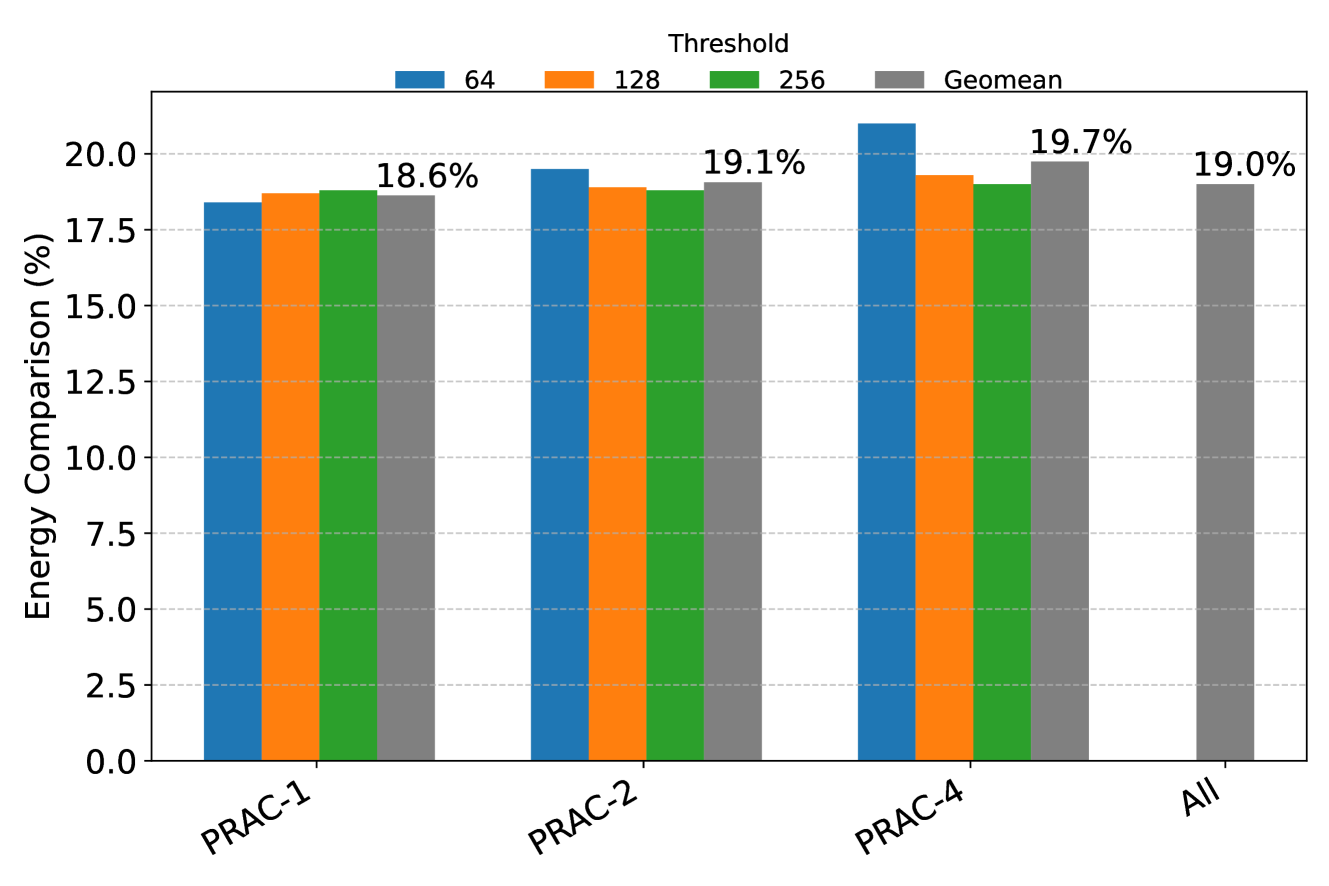
Bar chart comparing energy efficiency metrics across different Prac categories and thresholds.
## Axes
- **X-axis (Categories):**
- Prac-1
- Prac-2
- Prac-4
- All
- **Y-axis (Values):**
- Energy Comparison (%)
- Range: 0.0% to 20.0% (in 2.5% increments)
- Labels: Numerical percentages (e.g., 18.6%, 19.1%)
## Legend
- **Location:** Top of the chart
- **Color-Coded Thresholds:**
- **Blue (#1f77b4):** 64
- **Orange (#ff7f0e):** 128
- **Green (#2ca02c):** 256
- **Gray (#9467bd):** Geomean
## Data Points & Trends
### Prac-1
- **Threshold 64 (Blue):** 18.3%
- **Threshold 128 (Orange):** 18.5%
- **Threshold 256 (Green):** 18.6%
- **Geomean (Gray):** 18.6%
- *Trend:* Gradual increase from 64 to 256 thresholds, with Geomean matching the highest threshold.
### Prac-2
- **Threshold 64 (Blue):** 19.5%
- **Threshold 128 (Orange):** 19.0%
- **Threshold 256 (Green):** 19.0%
- **Geomean (Gray):** 19.1%
- *Trend:* Slight decline from 64 to 128/256 thresholds, with Geomean slightly higher than 128/256.
### Prac-4
- **Threshold 64 (Blue):** 20.8%
- **Threshold 128 (Orange):** 19.3%
- **Threshold 256 (Green):** 19.2%
- **Geomean (Gray):** 19.7%
- *Trend:* Sharp drop from 64 to 128/256 thresholds, with Geomean significantly higher than individual thresholds.
### All
- **Geomean (Gray):** 19.0%
- *Trend:* Single data point representing aggregated Geomean across all Prac categories.
## Key Observations
1. **Threshold Impact:**
- Higher thresholds (256) generally show lower energy efficiency than lower thresholds (64/128), except in Prac-4 where 64 outperforms others.
2. **Geomean Consistency:**
- Geomean values are consistently higher than individual thresholds in Prac-2 and Prac-4, suggesting a balancing effect.
3. **Aggregation ("All"):**
- The "All" category Geomean (19.0%) is lower than Prac-4's Geomean (19.7%), indicating variability across Prac categories.
## Spatial Grounding
- **Legend Position:** Top-center, aligned with x-axis categories.
- **Bar Alignment:** Each Prac category has four bars (64, 128, 256, Geomean), except "All," which has only Geomean.
## Component Isolation
- **Header:** Chart title ("Threshold") and legend.
- **Main Chart:** Four grouped bars per Prac category (except "All").
- **Footer:** Y-axis labels and percentage increments.
## Data Table Reconstruction
| Category | Threshold 64 (%) | Threshold 128 (%) | Threshold 256 (%) | Geomean (%) |
|----------|------------------|-------------------|-------------------|-------------|
| Prac-1 | 18.3 | 18.5 | 18.6 | 18.6 |
| Prac-2 | 19.5 | 19.0 | 19.0 | 19.1 |
| Prac-4 | 20.8 | 19.3 | 19.2 | 19.7 |
| All | - | - | - | 19.0 |
## Language Notes
- **Primary Language:** English (all labels, axis titles, and annotations).
- **No Additional Languages Detected.**