# Technical Document Extraction: Diagram Analysis
## Diagram Overview
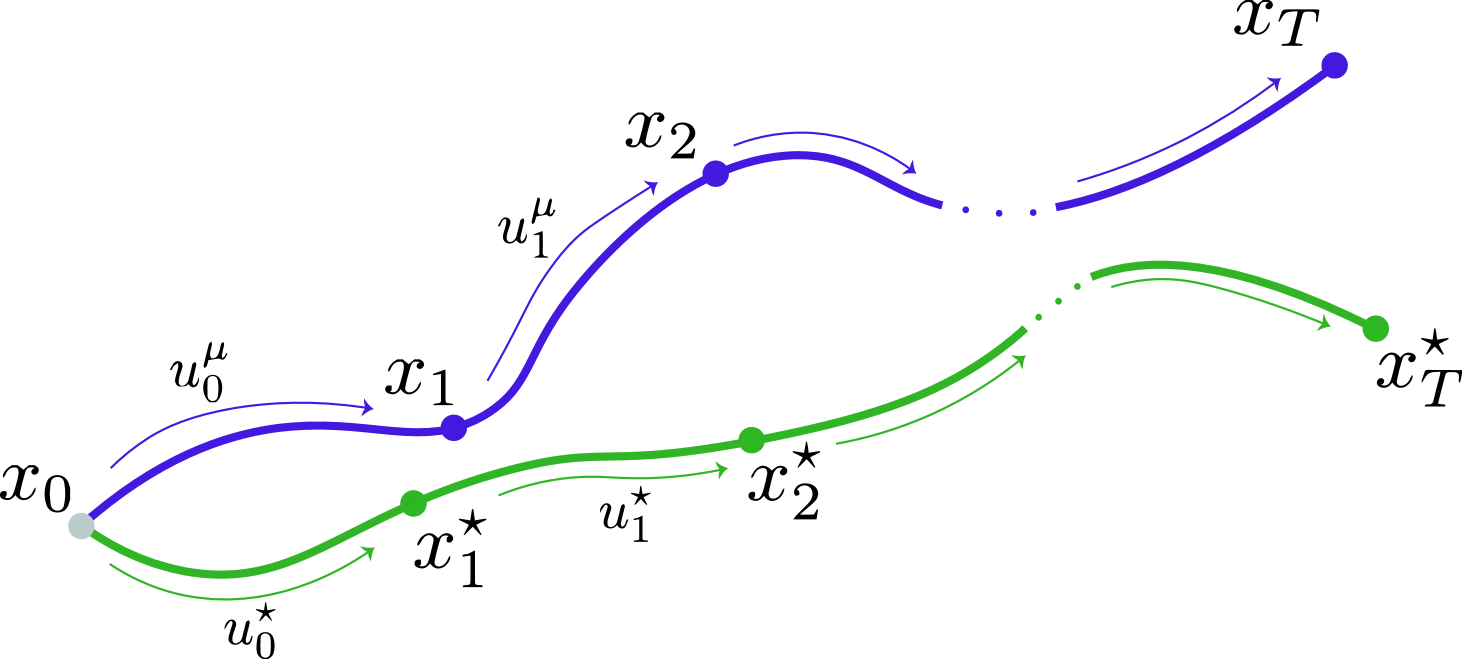
The image depicts a comparative diagram of two distinct paths (blue and green) connecting sequential points labeled \(x_0\) to \(x_T\) (blue) and \(x_0\) to \(x_T^*\) (green). The diagram emphasizes directional flow, labeled transitions, and symbolic differentiation between paths.
---
### **Key Components**
1. **Paths**:
- **Blue Path** (solid line):
- Connects points: \(x_0 \rightarrow x_1 \rightarrow x_2 \rightarrow x_T\).
- Arrows labeled: \(u_0^\mu\), \(u_1^\mu\).
- Spatial Position: Upper trajectory.
- **Green Path** (dashed line):
- Connects points: \(x_0 \rightarrow x_1^* \rightarrow x_2^* \rightarrow x_T^*\).
- Arrows labeled: \(u_0^*\), \(u_1^*\).
- Spatial Position: Lower trajectory.
2. **Labels**:
- **Points**:
- Blue: \(x_0, x_1, x_2, x_T\).
- Green: \(x_0, x_1^*, x_2^*, x_T^*\).
- **Arrows**:
- Blue: \(u_0^\mu, u_1^\mu\).
- Green: \(u_0^*, u_1^*\).
3. **Symbols**:
- Star notation (\(*\)) on green path points (\(x_1^*, x_2^*, x_T^*\)) suggests alternative or optimized states.
- Superscript \(\mu\) on blue arrows (\(u_0^\mu, u_1^\mu\)) may denote a specific mode or parameter (e.g., "mu-mode").
---
### **Flow and Trends**
- **Blue Path**:
- Smooth, upward-curving trajectory from \(x_0\) to \(x_T\).
- Arrows indicate sequential progression with \(\mu\)-labeled transitions.
- No intermediate discontinuities (solid line).
- **Green Path**:
- Dashed line with a more variable trajectory, ending at \(x_T^*\).
- Arrows labeled with star notation (\(u_0^*, u_1^*\)) suggest alternative or stochastic transitions.
- Starred endpoint (\(x_T^*\)) implies a divergent or optimized outcome compared to \(x_T\).
---
### **Color and Legend**
- **Color Coding**:
- Blue (solid): Primary or reference path.
- Green (dashed): Alternative or comparative path.
- **Legend**: Absent in the diagram. Color differentiation is inferred from line style and spatial positioning.
---
### **Spatial Grounding**
- **Coordinate Placement**:
- Blue path consistently above green path.
- Points \(x_0\) and \(x_T\) (blue) align vertically with \(x_0\) and \(x_T^*\) (green), suggesting shared origins but divergent endpoints.
---
### **Critical Observations**
1. **Path Divergence**:
- Blue path ends at \(x_T\); green path ends at \(x_T^*\), indicating a potential optimization or alternative outcome.
2. **Transition Labels**:
- \(\mu\)-labeled transitions (blue) vs. star-labeled transitions (green) may represent distinct operational modes or constraints.
3. **Star Symbolism**:
- Starred points (\(x_1^*, x_2^*, x_T^*\)) on the green path could denote critical nodes, milestones, or Pareto-optimal states.
---
### **Conclusion**
The diagram illustrates two competing or complementary trajectories between shared initial and terminal states (\(x_0\) and \(x_T\) vs. \(x_T^*\)). The blue path represents a standard progression, while the green path highlights an alternative strategy with starred nodes and transitions. The absence of a legend necessitates reliance on color and symbol conventions for interpretation.
**Note**: No numerical data or explicit axis titles are present. The diagram focuses on qualitative flow and symbolic differentiation.