## Diagram: Subproblem Localization Strategies
### Overview
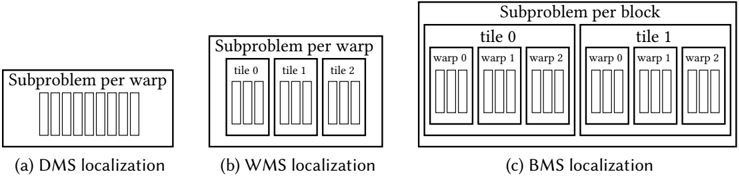
The image presents a diagram illustrating three different subproblem localization strategies: DMS (Device Memory Space), WMS (Warp Memory Space), and BMS (Block Memory Space). Each strategy depicts how subproblems are organized and accessed within a parallel processing environment, likely a GPU.
### Components/Axes
* **Titles:**
* (a) DMS localization
* (b) WMS localization
* (c) BMS localization
* **Labels:**
* Subproblem per warp (appears above the DMS and WMS diagrams)
* Subproblem per block (appears above the BMS diagram)
* tile 0, tile 1, tile 2 (labels within the WMS diagram)
* tile 0, tile 1 (labels within the BMS diagram)
* warp 0, warp 1, warp 2 (labels within the BMS diagram)
* **Diagram Elements:**
* Rectangles representing subproblems.
* Nested boxes representing different levels of memory hierarchy (warp, tile, block).
### Detailed Analysis
* **(a) DMS localization:**
* The diagram shows a single box labeled "Subproblem per warp".
* Inside the box, there are 8 small rectangles, presumably representing individual subproblems.
* Trend: The subproblems are arranged linearly.
* **(b) WMS localization:**
* The diagram shows a box labeled "Subproblem per warp".
* Inside the box, there are three tiles labeled "tile 0", "tile 1", and "tile 2".
* Each tile contains three small rectangles, presumably representing individual subproblems.
* Trend: The subproblems are grouped into tiles.
* **(c) BMS localization:**
* The diagram shows a box labeled "Subproblem per block".
* Inside the box, there are two tiles labeled "tile 0" and "tile 1".
* Each tile contains three warps labeled "warp 0", "warp 1", and "warp 2".
* Each warp contains three small rectangles, presumably representing individual subproblems.
* Trend: The subproblems are grouped into warps, which are grouped into tiles.
### Key Observations
* DMS localization has the simplest structure, with subproblems directly associated with a warp.
* WMS localization introduces the concept of tiles, grouping subproblems within a warp.
* BMS localization adds another level of hierarchy, grouping warps into tiles within a block.
* The number of subproblems per warp varies across the diagrams (8 in DMS, 3 per tile in WMS, 3 per warp in BMS).
### Interpretation
The diagram illustrates different strategies for organizing subproblems in a parallel processing environment. The choice of strategy depends on the specific problem and the architecture of the processing unit (e.g., GPU). DMS localization is likely suitable for problems where subproblems can be processed independently. WMS and BMS localization are likely used to improve data locality and reduce memory access latency by grouping related subproblems together. The hierarchical structure of BMS localization allows for fine-grained control over data placement and scheduling.