## Diagram: Subproblem Localization Structures
### Overview
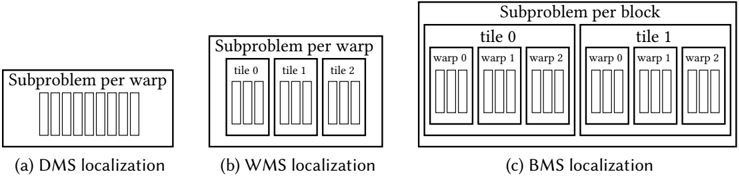
The image presents three technical diagrams illustrating different subproblem localization strategies: (a) DMS localization, (b) WMS localization, and (c) BMS localization. Each diagram uses rectangular blocks to represent computational units (warps, tiles, blocks) and their hierarchical organization.
### Components/Axes
1. **DMS Localization (a)**
- Title: "Subproblem per warp"
- Structure: Single row of 10 identical vertical rectangles (warps)
- Labels: No axis markers or numerical values
2. **WMS Localization (b)**
- Title: "Subproblem per warp"
- Structure: 3 horizontal tiles (tile 0, tile 1, tile 2), each containing 3 vertical rectangles (warps)
- Labels: Tile identifiers (0-2) positioned above each tile group
3. **BMS Localization (c)**
- Title: "Subproblem per block"
- Structure: 2 horizontal blocks (tile 0, tile 1), each containing 3 warps (warp 0-2), with each warp divided into 3 vertical rectangles
- Labels:
- Block identifiers (tile 0/1) at top of each block
- Warp identifiers (0-2) above each warp group
- No numerical values or axis markers
### Detailed Analysis
- **DMS Localization**: Simplest structure with direct 1:1 mapping between subproblems and warps (10 warps total)
- **WMS Localization**: Introduces tile-level organization (3 tiles × 3 warps = 9 warps total)
- **BMS Localization**: Most granular with block-tile-warp hierarchy (2 blocks × 3 tiles × 3 warps = 18 warps total)
- All diagrams use uniform rectangle proportions, suggesting equal computational load per unit
- No color coding or numerical differentiation between elements
### Key Observations
1. Hierarchical complexity increases from DMS → WMS → BMS
2. BMS localization shows 2× more blocks than WMS tiles
3. Warp count remains consistent (3 warps per tile/block in WMS/BMS)
4. No explicit performance metrics or timing data present
### Interpretation
This diagram illustrates three computational paradigms for parallel processing:
1. **DMS** represents basic warp-level parallelism
2. **WMS** adds tile-level organization for better resource utilization
3. **BMS** demonstrates block-level management for complex workloads
The progression suggests increasing architectural sophistication for handling computational dependencies. The absence of numerical data implies this is a conceptual model rather than performance benchmark. The uniform rectangle sizing indicates equal resource allocation per subproblem unit across all architectures.