## Line Graph: Relationship Between Number of Layers and Normalized Logarithmic Difference
### Overview
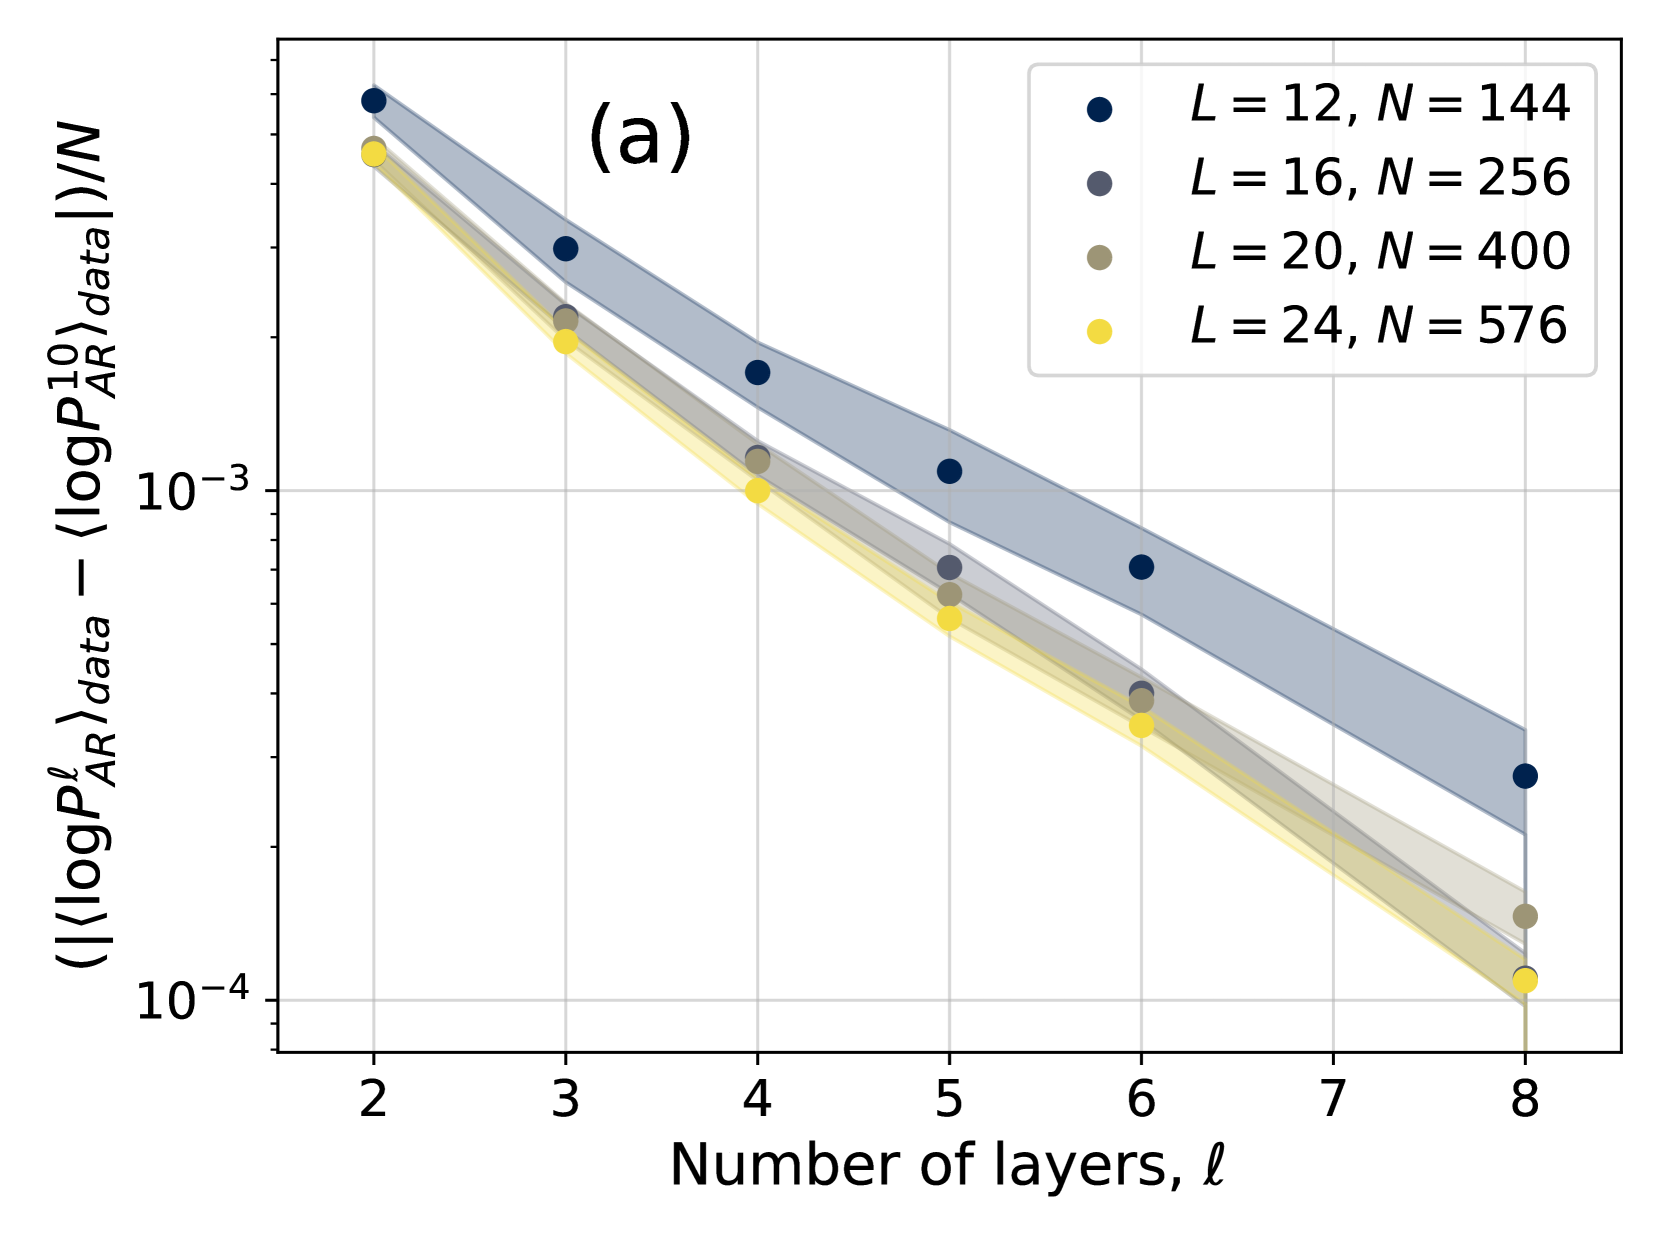
The graph illustrates the relationship between the number of layers (ℓ) and the normalized logarithmic difference between two quantities, ⟨logPℓ_AR⟩_data and ⟨logPℓ_AR⟩_data, scaled by N. Four distinct data series are plotted, each corresponding to different combinations of L (model size) and N (sample size). The y-axis uses a logarithmic scale, and shaded regions around each line likely represent confidence intervals or uncertainty bounds.
### Components/Axes
- **X-axis**: "Number of layers, ℓ" (integer values from 2 to 8).
- **Y-axis**: "(⟨logPℓ_AR⟩_data − ⟨logPℓ_AR⟩_data)/N" (logarithmic scale, ranging from ~10⁻⁴ to ~10⁻²).
- **Legend**: Located in the top-right corner, with four entries:
- Dark blue circles: L = 12, N = 144
- Gray circles: L = 16, N = 256
- Olive circles: L = 20, N = 400
- Yellow circles: L = 24, N = 576
### Detailed Analysis
1. **Data Series Trends**:
- **Dark Blue (L=12, N=144)**: Starts at ~1.2×10⁻² for ℓ=2, decreasing steeply to ~8×10⁻³ at ℓ=8. The shaded region (confidence interval) is widest, indicating high variability.
- **Gray (L=16, N=256)**: Begins at ~9×10⁻³ for ℓ=2, declining to ~5×10⁻³ at ℓ=8. The shaded area narrows slightly compared to dark blue.
- **Olive (L=20, N=400)**: Starts at ~7×10⁻³ for ℓ=2, dropping to ~4×10⁻³ at ℓ=8. The confidence interval is tighter than the previous two series.
- **Yellow (L=24, N=576)**: Begins at ~6×10⁻³ for ℓ=2, decreasing to ~3×10⁻³ at ℓ=8. The shaded region is the narrowest, suggesting the most stable measurements.
2. **Key Observations**:
- All series exhibit a **downward trend** as ℓ increases, with higher L values showing less steep declines.
- The **dark blue series (L=12)** has the highest initial value and widest confidence interval, while the **yellow series (L=24)** has the smallest spread.
- The **y-axis values decrease by ~1–2 orders of magnitude** across the ℓ range for all series.
### Interpretation
The graph suggests that increasing the number of layers (ℓ) reduces the normalized logarithmic difference between the two quantities, with larger model sizes (L) and sample sizes (N) associated with more stable or consistent results. The widening confidence intervals for smaller L and N (e.g., dark blue) imply greater uncertainty in measurements for smaller models or datasets. Conversely, larger L and N (e.g., yellow) show tighter bounds, indicating improved reliability. This could reflect trade-offs between model complexity, data efficiency, and measurement precision in the studied system.