## Line Chart: Retention Ratio vs. Training Steps for Qwen3 Models
### Overview
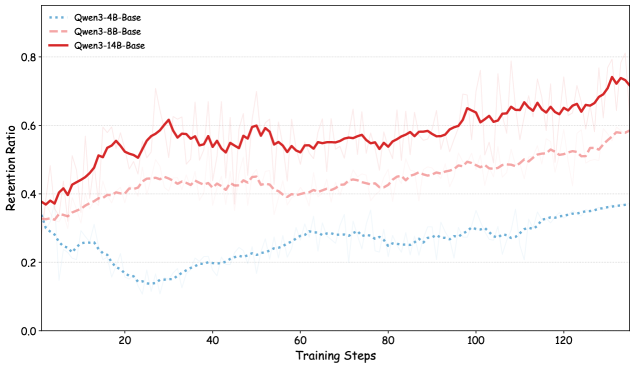
The image is a line chart comparing the retention ratio of three Qwen3 models (4B-Base, 8B-Base, and 14B-Base) over a range of training steps. The chart displays the retention ratio on the y-axis and the training steps on the x-axis. Each model is represented by a different colored line.
### Components/Axes
* **Title:** There is no explicit title on the chart.
* **X-axis:**
* Label: "Training Steps"
* Scale: 0 to 120, with tick marks every 20 steps.
* **Y-axis:**
* Label: "Retention Ratio"
* Scale: 0.0 to 0.8, with tick marks every 0.2.
* **Legend:** Located in the top-left corner.
* Blue dotted line: "Qwen3-4B-Base"
* Pink dashed line: "Qwen3-8B-Base"
* Red solid line: "Qwen3-14B-Base"
### Detailed Analysis
* **Qwen3-4B-Base (Blue dotted line):**
* Trend: Starts at approximately 0.3, decreases to around 0.15 by step 20, and then gradually increases to approximately 0.4 by step 120.
* Data Points:
* Step 0: ~0.3
* Step 20: ~0.15
* Step 120: ~0.4
* **Qwen3-8B-Base (Pink dashed line):**
* Trend: Starts at approximately 0.35, increases to around 0.5 by step 40, and then remains relatively stable between 0.5 and 0.6 until step 120.
* Data Points:
* Step 0: ~0.35
* Step 40: ~0.5
* Step 120: ~0.6
* **Qwen3-14B-Base (Red solid line):**
* Trend: Starts at approximately 0.4, increases to around 0.6 by step 40, fluctuates between 0.55 and 0.65 until step 100, and then increases to approximately 0.75 by step 120.
* Data Points:
* Step 0: ~0.4
* Step 40: ~0.6
* Step 100: ~0.6
* Step 120: ~0.75
### Key Observations
* The Qwen3-14B-Base model consistently exhibits the highest retention ratio throughout the training steps.
* The Qwen3-4B-Base model starts with a relatively high retention ratio, drops significantly in the early training steps, and then gradually recovers.
* The Qwen3-8B-Base model shows a steady increase in retention ratio during the initial training steps and then plateaus.
### Interpretation
The chart illustrates the relationship between model size (4B, 8B, 14B) and retention ratio during training. The Qwen3-14B-Base model, being the largest, demonstrates the best retention performance, suggesting that larger models may have a better capacity to retain information during training. The Qwen3-4B-Base model's initial drop in retention ratio could indicate an initial instability or adaptation phase, while its subsequent recovery suggests that it eventually learns to retain information, albeit at a lower level than the larger models. The Qwen3-8B-Base model's behavior is intermediate, showing a good initial increase in retention but then plateauing, indicating a possible saturation point for that model size within the given training parameters. Overall, the data suggests that increasing model size correlates with improved retention ratio, but the specific training dynamics can vary significantly between models.