\n
## Line Chart: Retention Ratio vs. Training Steps for Qwen Models
### Overview
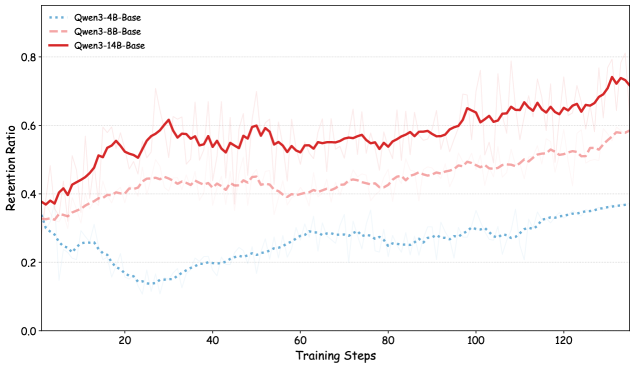
This line chart depicts the retention ratio of three Qwen language models (Qwen-4B-Base, Qwen-8B-Base, and Qwen-14B-Base) over 120 training steps. The chart visualizes how well each model retains information during training, with the retention ratio ranging from approximately 0.0 to 0.8. Each line also includes a shaded region representing the standard deviation around the mean retention ratio.
### Components/Axes
* **X-axis:** Training Steps (ranging from 0 to 120, with markers at intervals of 20)
* **Y-axis:** Retention Ratio (ranging from 0.0 to 0.8, with markers at intervals of 0.2)
* **Legend:** Located in the top-left corner, identifying the three data series:
* Qwen-4B-Base (represented by a dotted blue line)
* Qwen-8B-Base (represented by a dashed red line)
* Qwen-14B-Base (represented by a solid red line)
### Detailed Analysis
* **Qwen-4B-Base (Blue, Dotted):** This line starts at approximately 0.25 at step 0 and generally trends downward, reaching a minimum of around 0.18 at step 40. It then fluctuates between approximately 0.2 and 0.3, ending at around 0.28 at step 120. The shaded region around the line indicates a relatively small standard deviation.
* **Qwen-8B-Base (Red, Dashed):** This line begins at approximately 0.38 at step 0 and exhibits an upward trend until around step 60, reaching a peak of approximately 0.52. After step 60, it fluctuates, generally decreasing to around 0.45 at step 120. The shaded region is wider than that of the 4B model, indicating a larger standard deviation.
* **Qwen-14B-Base (Red, Solid):** This line shows the most significant upward trend. Starting at approximately 0.42 at step 0, it consistently increases, reaching approximately 0.75 at step 100. It then plateaus and slightly decreases to around 0.72 at step 120. The shaded region is relatively wide, indicating a substantial standard deviation, particularly in the earlier training steps.
### Key Observations
* The Qwen-14B-Base model consistently demonstrates the highest retention ratio throughout the training process.
* The Qwen-4B-Base model exhibits the lowest retention ratio and a generally decreasing trend.
* The Qwen-8B-Base model shows an initial increase in retention ratio, followed by stabilization and slight decline.
* The standard deviation is largest for the Qwen-14B-Base model, suggesting greater variability in its retention performance.
### Interpretation
The data suggests a strong correlation between model size and retention ratio. Larger models (14B parameters) exhibit significantly better retention capabilities than smaller models (4B and 8B parameters). The initial increase in retention for the 8B model could indicate a period of rapid learning, followed by saturation. The consistently high retention of the 14B model suggests it is better equipped to capture and retain information during training. The standard deviations indicate that the 14B model's performance is more variable, potentially due to its increased complexity and capacity. This variability could be a result of the model being more sensitive to the specific training data or hyperparameters. The downward trend of the 4B model suggests it may be struggling to learn effectively or is prone to overfitting. The chart demonstrates the importance of model capacity in achieving high retention rates during language model training.