\n
## Diagram: Knowledge Graph Embedding Model
### Overview
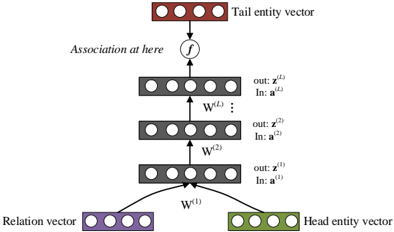
The image depicts a diagram of a knowledge graph embedding model, likely a translational distance model or a similar architecture. It illustrates the process of combining head entity, relation, and tail entity vectors through a series of transformations to learn embeddings. The diagram shows a multi-layered neural network structure.
### Components/Axes
The diagram consists of the following components:
* **Head Entity Vector:** Located at the bottom-right, represented by a row of green circles.
* **Relation Vector:** Located at the bottom-left, represented by a row of purple circles.
* **Tail Entity Vector:** Located at the top, represented by a row of red circles.
* **Layers:** Three rectangular blocks, each containing a row of grey circles, representing hidden layers.
* **Weights:** Labels `W^(1)`, `W^(2)`, `W^(L)` indicate weight matrices connecting the layers.
* **Association Function:** A circle labeled 'f' represents an association function.
* **Input/Output Labels:** Each layer has labels "In: a^(i)" and "out: z^(i)", where 'i' represents the layer number.
* **Text Label:** "Association at here" is positioned above the association function.
### Detailed Analysis or Content Details
The diagram shows a flow of information from the Head Entity Vector and Relation Vector through the layers to the Tail Entity Vector.
1. **Input Layer:** The Head Entity Vector and Relation Vector are inputs to the first layer.
2. **Layer 1:** The inputs are transformed using weight matrix `W^(1)` to produce an output `z^(1)`. The input to this layer is labeled `a^(1)`.
3. **Layer 2:** The output `z^(1)` from Layer 1 is transformed using weight matrix `W^(2)` to produce an output `z^(2)`. The input to this layer is labeled `a^(2)`.
4. **Layer L:** The output `z^(L-1)` from the previous layer is transformed using weight matrix `W^(L)` to produce an output `z^(L)`. The input to this layer is labeled `a^(L)`.
5. **Association Function:** The output `z^(L)` is then fed into the association function 'f', which combines it with the Tail Entity Vector.
The number of circles in each vector (Head, Relation, Tail) and each layer appears to be approximately 8. The diagram does not provide specific numerical values for the weights or the outputs of each layer.
### Key Observations
* The diagram illustrates a feedforward neural network architecture.
* The weight matrices `W^(1)`, `W^(2)`, and `W^(L)` suggest that the model learns transformations between the input vectors and the output vectors.
* The association function 'f' is a crucial component, likely performing a non-linear operation to combine the transformed vector with the tail entity.
* The diagram does not specify the activation function used in the layers or the specific form of the association function 'f'.
### Interpretation
This diagram represents a simplified view of a knowledge graph embedding model. The goal of such a model is to learn vector representations (embeddings) of entities and relations in a knowledge graph. These embeddings can then be used for various downstream tasks, such as link prediction (predicting missing relationships between entities) or entity classification.
The diagram suggests that the model learns to transform the head entity and relation vectors into a space where they can be combined with the tail entity vector. The association function 'f' likely measures the compatibility or similarity between the combined vector and the tail entity vector. The weights `W^(i)` are learned during training to minimize a loss function that encourages the embeddings of related entities to be close together in the embedding space.
The multi-layered structure allows the model to learn complex non-linear relationships between entities and relations. The diagram does not provide enough information to determine the specific type of embedding model (e.g., TransE, DistMult, ComplEx), but it provides a general overview of the architecture. The lack of specific numerical values or equations suggests that the diagram is intended to be a conceptual illustration rather than a precise mathematical representation.