## Diagram: Neural Network Architecture for Entity-Relation Association
### Overview
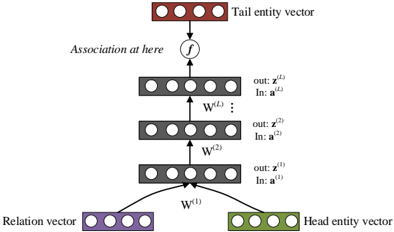
The image displays a schematic diagram of a feedforward neural network architecture designed to model the association between a head entity, a relation, and a tail entity. The flow of information is from the bottom (inputs) to the top (output).
### Components/Axes
The diagram is composed of several distinct components, labeled with text and mathematical notation. The primary components are:
1. **Input Vectors (Bottom):**
* **Head entity vector:** Located at the bottom-right. Represented by a green rectangular box containing five white circles (nodes).
* **Relation vector:** Located at the bottom-left. Represented by a purple rectangular box containing five white circles (nodes).
* These two vectors are the inputs to the network.
2. **First Weight Layer:**
* Labeled **W⁽¹⁾**. This is a matrix or transformation layer that processes the concatenated or combined input from the Head entity vector and Relation vector. Arrows from both input vectors point to this layer.
3. **Hidden Layers (Middle):**
* A stack of three gray rectangular layers, each containing five white circles (nodes).
* The layers are connected sequentially by upward-pointing arrows.
* The lowest hidden layer is associated with the weight matrix **W⁽²⁾**.
* The middle hidden layer is associated with the weight matrix **W⁽ᴸ⁾** (where 'L' likely denotes the final or a specific layer index).
* The top hidden layer is also associated with **W⁽ᴸ⁾**, indicating it may be the last in a series (denoted by the vertical ellipsis "⋮" between the middle and top layers).
* To the right of each hidden layer, there are output and input labels:
* For the top hidden layer: `out: z⁽ᴸ⁾`, `in: a⁽ᴸ⁾`
* For the middle hidden layer: `out: z⁽²⁾`, `in: a⁽²⁾`
* For the bottom hidden layer: `out: z⁽¹⁾`, `in: a⁽¹⁾`
4. **Association Function:**
* Located above the top hidden layer. Represented by a circle containing the function symbol **ƒ**.
* An arrow points from the top hidden layer's output (`z⁽ᴸ⁾`) into this function.
* The text **"Association at here"** is placed to the left of this function, indicating this is where the core associative computation occurs.
5. **Output Vector (Top):**
* **Tail entity vector:** Located at the top-center. Represented by a red rectangular box containing five white circles (nodes).
* An arrow points from the association function **ƒ** to this output vector.
### Detailed Analysis
* **Flow Direction:** The data flow is strictly bottom-up: `Head entity vector` + `Relation vector` → `W⁽¹⁾` → `Hidden Layer 1 (a⁽¹⁾, z⁽¹⁾)` → `W⁽²⁾` → `Hidden Layer 2 (a⁽²⁾, z⁽²⁾)` → ... → `Hidden Layer L (a⁽ᴸ⁾, z⁽ᴸ⁾)` → `Association Function ƒ` → `Tail entity vector`.
* **Notation:** The notation uses superscripts in parentheses `(1), (2), (L)` to denote layer indices. `a` likely represents the pre-activation or input to a layer, and `z` represents the post-activation or output of a layer.
* **Spatial Grounding:** The legend is implicit through color-coding and labels. The **Head entity** is consistently green and positioned bottom-right. The **Relation** is purple and positioned bottom-left. The **Tail entity** is red and positioned at the top as the output. The hidden layers are neutral gray and stacked centrally.
### Key Observations
1. **Architecture Type:** This is a multi-layer perceptron (MLP) or deep neural network designed for a specific predictive task in representation learning.
2. **Input Structure:** The model takes two distinct semantic inputs (head and relation) and processes them jointly from the first layer onward.
3. **Output Goal:** The network's explicit goal is to produce a "Tail entity vector," suggesting it is trained to predict or complete knowledge graph triples of the form (Head, Relation, Tail).
4. **The "Association" Function:** The placement of the `ƒ` function after the final hidden layer is notable. It may represent a final non-linear transformation, a similarity measure (like a dot product), or a decoding step that maps the learned hidden representation to the tail entity space.
### Interpretation
This diagram illustrates a **knowledge graph completion model**. The core idea is to learn distributed vector representations (embeddings) for entities (head, tail) and relations. The network takes the vector for a known head entity and a relation, processes them through multiple non-linear transformation layers (`W⁽¹⁾` to `W⁽ᴸ⁾`), and attempts to reconstruct or predict the vector for the associated tail entity.
The "Association at here" label highlights the critical point where the model, having processed the input pair through its hidden layers, makes its final computation to associate the learned features with a specific tail entity output. The success of this model would be measured by its ability to produce the correct tail entity vector for a given (head, relation) pair, effectively "filling in" missing links in a knowledge base. The use of multiple hidden layers suggests the model is designed to capture complex, non-linear interactions between entities and relations.