## 3D Surface Plot: Minimized Energy vs. Theta 1 and Theta 2
### Overview
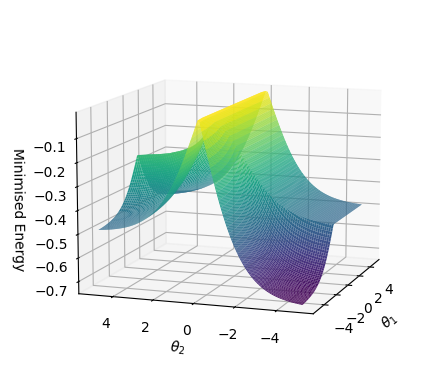
The image is a 3D surface plot visualizing the relationship between "Minimized Energy" and two variables, theta1 and theta2. The surface is colored according to the energy level, ranging from purple (low energy) to yellow (high energy). The plot shows how the minimized energy changes as theta1 and theta2 vary.
### Components/Axes
* **X-axis (Theta 1):** Ranges from approximately -5 to 5.
* **Y-axis (Theta 2):** Ranges from approximately -5 to 5.
* **Z-axis (Minimized Energy):** Ranges from -0.7 to -0.1.
* **Color Gradient:** Represents the minimized energy level, with purple indicating lower energy and yellow indicating higher energy.
### Detailed Analysis
* **Theta 1:** The x-axis ranges from -4 to 4, with gridlines at every increment of 2.
* **Theta 2:** The y-axis ranges from -4 to 4, with gridlines at every increment of 2.
* **Minimized Energy:** The z-axis ranges from -0.7 to -0.1, with gridlines at every increment of 0.1.
**Surface Plot Analysis:**
* The surface has two distinct minima, located at approximately (Theta1 = -4, Theta2 = 4) and (Theta1 = 4, Theta2 = -4). At these points, the minimized energy is approximately -0.7.
* The surface rises sharply to a peak located near (Theta1 = 0, Theta2 = 0), where the minimized energy reaches approximately -0.1.
* The surface exhibits symmetry with respect to the origin.
### Key Observations
* The plot shows a clear relationship between the minimized energy and the values of theta1 and theta2.
* The presence of two minima suggests that there are two sets of parameters (theta1, theta2) that result in low energy states.
* The peak at the origin indicates that when both theta1 and theta2 are close to zero, the minimized energy is high.
### Interpretation
The 3D surface plot visualizes an energy landscape. The two minima suggest the existence of two stable states or optimal parameter configurations. The high energy peak at the origin indicates an unstable or unfavorable configuration. The symmetry of the plot suggests that the roles of theta1 and theta2 are interchangeable in determining the minimized energy. This type of plot is commonly used in optimization problems to visualize the objective function and identify potential solutions.