\n
## 3D Surface Plot: Minimized Energy Landscape
### Overview
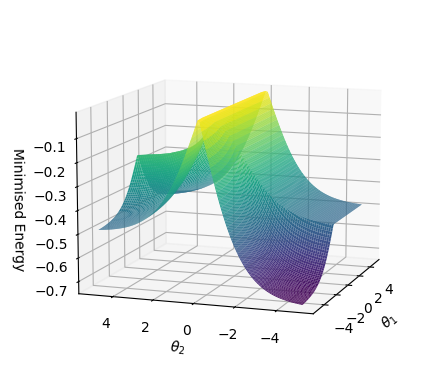
The image depicts a 3D surface plot representing a minimized energy landscape. The plot visualizes the relationship between two angular parameters, θ₁ and θ₂, and the resulting minimized energy. The surface exhibits a complex shape with multiple local minima and a prominent central peak.
### Components/Axes
* **X-axis:** θ₂ (Theta 2), ranging approximately from -4 to 4.
* **Y-axis:** θ₁ (Theta 1), ranging approximately from -4 to 4.
* **Z-axis:** Minimized Energy, ranging approximately from -0.7 to -0.1.
* **Surface:** The colored surface represents the minimized energy value for different combinations of θ₁ and θ₂. The color gradient indicates energy levels, with cooler colors (purple/blue) representing lower energy and warmer colors (yellow/green) representing higher energy.
* **Grid:** A grid is visible on the plot, providing a visual reference for the coordinate values.
### Detailed Analysis
The surface shows a complex energy landscape.
* **Central Peak:** A prominent peak is located near θ₁ = 0 and θ₂ = 0, with energy values around -0.1. This suggests a local maximum in energy.
* **Left Minimum:** A broad minimum is present on the left side of the plot, approximately at θ₁ = -4 and θ₂ = 4, with energy values around -0.7.
* **Right Minimum:** A similar broad minimum is present on the right side of the plot, approximately at θ₁ = 4 and θ₂ = -4, with energy values around -0.7.
* **Saddle Points:** There appear to be saddle points or regions of rapid energy change between the minima and the central peak.
* **Color Gradient:** The color gradient transitions smoothly from purple (low energy) to yellow (high energy), indicating a continuous energy landscape.
### Key Observations
* The energy landscape is not symmetrical. The minima are not perfectly mirrored across the origin.
* The presence of multiple minima suggests the possibility of multiple stable states or configurations.
* The central peak indicates an unstable state, where small perturbations could lead to a transition to one of the minima.
* The plot does not provide specific numerical values for the energy at each point, only a visual representation of the energy landscape.
### Interpretation
This plot likely represents the energy landscape of a physical system with two degrees of freedom, represented by the angles θ₁ and θ₂. The minima in the energy landscape correspond to stable states of the system, while the peak represents an unstable state. The shape of the landscape dictates the system's behavior and the likelihood of transitions between different states.
The asymmetry of the landscape suggests that the system is not invariant under certain transformations. The multiple minima indicate that the system can exist in different stable configurations, and the energy barrier between these configurations determines the rate of transitions between them.
This type of plot is commonly used in fields such as molecular dynamics, statistical mechanics, and machine learning to visualize and analyze complex energy landscapes. It can provide insights into the stability, dynamics, and behavior of the system under investigation.