## 3D Surface Plot: Minimised Energy Landscape
### Overview
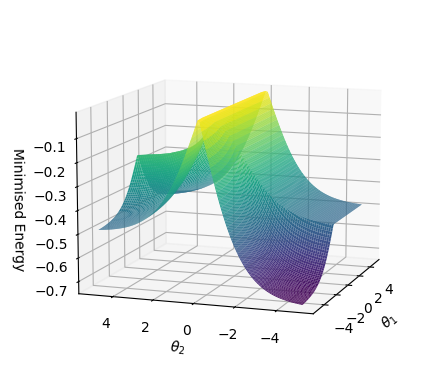
The image depicts a 3D surface plot visualizing a minimised energy landscape as a function of two angular parameters, θ₁ and θ₂. The plot uses a color gradient (purple to yellow) to represent energy values, with a grid overlay for spatial reference. The surface exhibits multiple peaks and troughs, indicating variations in energy across the parameter space.
### Components/Axes
- **X-axis (θ₂)**: Ranges from -4 to 4, labeled with integer markers at -4, -2, 0, 2, 4.
- **Y-axis (θ₁)**: Ranges from -4 to 4, labeled with integer markers at -4, -2, 0, 2, 4.
- **Z-axis (Minimised Energy)**: Ranges from -0.7 to -0.1, with grid lines at intervals of 0.1.
- **Color Gradient**: Implicit legend mapping energy values to colors:
- Purple: Lowest energy (~-0.7)
- Yellow: Highest energy (~-0.1)
- **Grid**: Black grid lines on all three axes for spatial grounding.
### Detailed Analysis
1. **Energy Peaks**:
- **Highest Peak**: Located at θ₁ ≈ 0, θ₂ ≈ 0, with energy ≈ -0.1 (yellow region).
- **Secondary Peaks**:
- θ₁ ≈ 2, θ₂ ≈ 2 (energy ≈ -0.3, green region).
- θ₁ ≈ -2, θ₂ ≈ -2 (energy ≈ -0.3, green region).
2. **Energy Troughs**:
- **Deepest Trough**: Located at θ₁ ≈ -4, θ₂ ≈ -4, with energy ≈ -0.7 (purple region).
- **Secondary Troughs**:
- θ₁ ≈ 4, θ₂ ≈ 4 (energy ≈ -0.5, blue region).
- θ₁ ≈ -4, θ₂ ≈ 4 (energy ≈ -0.6, dark blue region).
3. **Saddle Point**:
- A saddle-shaped structure is observed near θ₁ ≈ 2, θ₂ ≈ 2, where energy transitions from a local minimum to a local maximum.
4. **Symmetry**:
- The plot exhibits approximate symmetry about the origin (θ₁=0, θ₂=0), with mirrored energy distributions in opposite quadrants.
### Key Observations
- The energy landscape is non-uniform, with distinct minima and maxima.
- The deepest energy trough (-0.7) occurs at the extreme negative values of both θ₁ and θ₂.
- The saddle point near θ₁=2, θ₂=2 suggests a critical transition region in the parameter space.
- Energy values increase (become less negative) as the parameters move toward the origin.
### Interpretation
This plot represents a potential energy surface, likely from a physical or mathematical optimization problem. The minima correspond to stable equilibrium states, while the saddle point indicates an unstable equilibrium. The symmetry suggests the system may have conserved properties or rotational invariance. The color gradient provides a visual cue for energy density, with purple regions representing the most energetically favorable configurations. The plot highlights the importance of parameter tuning (θ₁, θ₂) to achieve desired energy states, with practical implications for optimization algorithms or physical system design.