## Diagram: Unit Circle with Complex Plane Points
### Overview
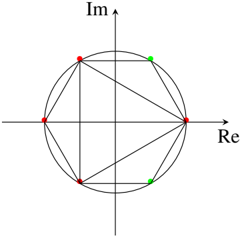
The image depicts a unit circle centered at the origin of a Cartesian coordinate system, overlaid with labeled points and connecting lines. The diagram emphasizes geometric relationships between points on the real-imaginary plane, with color-coded markers and annotated coordinates.
### Components/Axes
- **Axes**:
- Horizontal axis labeled "Re" (Real)
- Vertical axis labeled "Im" (Imaginary)
- **Circle**:
- Unit circle (radius = 1) centered at (0,0)
- **Legend**:
- Located in the top-right quadrant
- Red markers: "Real Axis Points"
- Green markers: "Diagonal Points"
### Detailed Analysis
1. **Points**:
- **Red Points** (Real Axis):
- (1, 0) – Rightmost point on the real axis
- (-1, 0) – Leftmost point on the real axis
- (0, 1) – Topmost point on the imaginary axis
- (0, -1) – Bottommost point on the imaginary axis
- **Green Points** (Diagonal):
- (√2/2, √2/2) ≈ (0.707, 0.707) – 45° angle in the first quadrant
- (-√2/2, -√2/2) ≈ (-0.707, -0.707) – 225° angle in the third quadrant
2. **Lines**:
- Connect red and green points to form right triangles and intersecting diagonals
- Lines extend from green points to adjacent red points (e.g., (√2/2, √2/2) connects to (1,0) and (0,1))
- Additional lines form a star-like pattern within the circle
3. **Spatial Grounding**:
- Legend: Top-right quadrant
- Red points: Symmetrically placed along the axes
- Green points: Positioned at 45° and 225° relative to the origin
### Key Observations
- Symmetry: Points are evenly distributed across quadrants
- Coordinate precision: Green points use irrational numbers (√2/2), approximated as ±0.707
- Line intersections: All lines pass through the origin or connect points at right angles
- No numerical scale beyond unit circle radius (1)
### Interpretation
This diagram illustrates the geometric relationships between complex numbers on the unit circle, emphasizing:
1. **Real/Imaginary Axis Points**: Represent pure real or imaginary numbers (e.g., 1, -1, i, -i)
2. **Diagonal Points**: Represent complex numbers with equal real and imaginary components (e.g., 1+i, -1-i)
3. **Geometric Transformations**: The connecting lines may symbolize operations like rotation or conjugation in the complex plane
4. **Symmetry**: The arrangement highlights rotational symmetry (90° increments) and reflectional symmetry across axes
The diagram likely serves as a visual aid for understanding complex number properties, particularly their representation on the complex plane and relationships between different quadrants.