## Pole-Zero Plot: Unit Circle
### Overview
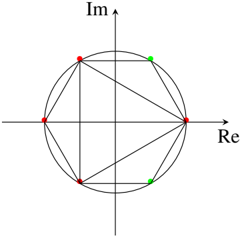
The image is a pole-zero plot on the complex plane, showing the locations of poles (red dots) and zeros (green dots) on the unit circle. The plot includes the real (Re) and imaginary (Im) axes, a circle representing the unit circle, and lines connecting the points.
### Components/Axes
* **Real Axis (Re):** Horizontal axis.
* **Imaginary Axis (Im):** Vertical axis.
* **Unit Circle:** A circle centered at the origin with a radius of 1.
* **Poles:** Represented by red dots.
* **Zeros:** Represented by green dots.
### Detailed Analysis
* **Poles (Red Dots):**
* Located at approximately:
* Re = -1, Im = 0
* Re = 1, Im = 0
* Re = -0.5, Im = 0.866
* Re = -0.5, Im = -0.866
* **Zeros (Green Dots):**
* Located at approximately:
* Re = 0.5, Im = 0.866
* Re = 0.5, Im = -0.866
### Key Observations
* The poles and zeros are located on the unit circle.
* There are 4 poles and 2 zeros.
* The poles and zeros appear to be symmetrically distributed around the real axis.
### Interpretation
The pole-zero plot represents the frequency response of a system. The location of the poles and zeros on the complex plane determines the stability and behavior of the system. In this case, the poles and zeros being on the unit circle suggests that the system may have oscillatory behavior. The specific arrangement of poles and zeros will determine the exact frequency response characteristics. The symmetry around the real axis indicates that the system has real-valued coefficients.