\n
## Diagram: Unit Circle with Points and Lines
### Overview
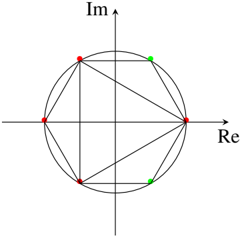
The image depicts a unit circle in the complex plane, with several points marked on its circumference. Lines connect these points, forming a polygon inscribed within the circle. The axes are labeled "Re" (Real) and "Im" (Imaginary). The points are colored red and green.
### Components/Axes
* **Axes:**
* Horizontal axis labeled "Re" (Real).
* Vertical axis labeled "Im" (Imaginary).
* **Circle:** A unit circle centered at the origin (0,0).
* **Points:** Six points are marked on the circumference of the circle. Three are red, and three are green.
* **Lines:** Lines connect the points in an alternating red-green-red-green-red-green sequence, forming a hexagon.
### Detailed Analysis
The points are positioned approximately as follows (estimated coordinates based on the unit circle):
* **Red Points:**
* Point 1: (0.7, 0.7) - Top-left quadrant
* Point 2: (-0.8, 0.6) - Top-left quadrant
* Point 3: (-0.6, -0.8) - Bottom-left quadrant
* **Green Points:**
* Point 1: (0.8, -0.6) - Bottom-right quadrant
* Point 2: (0.6, -0.8) - Bottom-right quadrant
* Point 3: (0.7, 0.7) - Top-right quadrant
The lines connect the points in the following order: Red 1 -> Green 1 -> Red 2 -> Green 2 -> Red 3 -> Green 3 -> Red 1. This forms a closed polygon.
### Key Observations
* The points are not evenly spaced around the circle.
* The polygon formed by connecting the points is not a regular hexagon.
* The alternating color scheme (red-green) suggests a possible distinction or grouping of the points.
* The diagram appears to illustrate a geometric representation of complex numbers or roots of unity.
### Interpretation
The diagram likely represents complex numbers on the complex plane. The points on the unit circle represent complex numbers with a magnitude of 1. The lines connecting the points could represent relationships between these complex numbers, such as roots of a polynomial equation. The alternating colors might indicate different properties or classifications of the complex numbers.
The non-uniform spacing of the points suggests that they are not necessarily evenly distributed roots of unity. The diagram could be illustrating a specific set of complex numbers with a particular relationship to each other, or it could be a visual representation of a more complex mathematical concept. Without additional context, it's difficult to determine the precise meaning of the diagram. It could be related to topics like Fourier analysis, signal processing, or number theory.