\n
## Diagram: Microphone and Sound Wave Interaction
### Overview
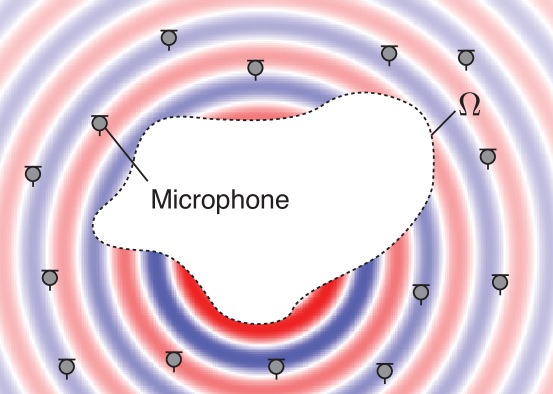
The image depicts a diagram illustrating the interaction between a microphone and surrounding sound waves. Concentric waves, alternating between red and blue hues, emanate outwards. A microphone is positioned centrally, partially obscuring the wave pattern. A dotted line outlines a region labeled "Ω" around the microphone. Small circular icons with arrows pointing outwards are distributed around the microphone, seemingly representing sound sources or wave propagation.
### Components/Axes
* **Microphone:** Central component, white in color.
* **Sound Waves:** Concentric, alternating red and blue waves.
* **Region Ω:** Dotted line outlining an area around the microphone.
* **Sound Source Icons:** Small circles with outward-pointing arrows, positioned around the microphone.
* **Arrow:** A black arrow points from the microphone towards one of the sound source icons.
### Detailed Analysis or Content Details
The diagram shows a microphone positioned within a field of sound waves. The waves are represented as concentric circles, alternating between red and blue. The red waves appear to be more concentrated at the bottom of the microphone, while the blue waves are more prominent at the top. The dotted line labeled "Ω" encloses a region around the microphone, suggesting a defined area of interaction or influence. The small circular icons with arrows are distributed around the microphone, indicating potential sources of sound or directions of wave propagation. The arrow originating from the microphone points towards one of these icons, possibly indicating a transmission or detection pathway.
There are approximately 12 sound source icons distributed around the microphone. The icons are evenly spaced around the microphone.
### Key Observations
* The alternating red and blue waves suggest different phases or intensities of the sound waves.
* The concentration of red waves at the bottom of the microphone might indicate a specific frequency or characteristic of the sound.
* The region "Ω" highlights the area where the microphone interacts with the sound field.
* The arrow suggests a directional relationship between the microphone and the sound sources.
### Interpretation
This diagram likely illustrates the principle of sound detection by a microphone. The concentric waves represent sound pressure variations, and the microphone is designed to convert these variations into an electrical signal. The region "Ω" could represent the effective capture area of the microphone, where sound waves are most strongly detected. The alternating colors of the waves might represent constructive and destructive interference, influencing the signal received by the microphone. The arrow suggests that the microphone can both receive sound from sources and potentially transmit signals. The diagram is a simplified representation of a complex physical phenomenon, focusing on the fundamental interaction between a microphone and its acoustic environment. It does not provide quantitative data, but rather a conceptual visualization of the process.