\n
## Line Chart: Cosine Similarity
### Overview
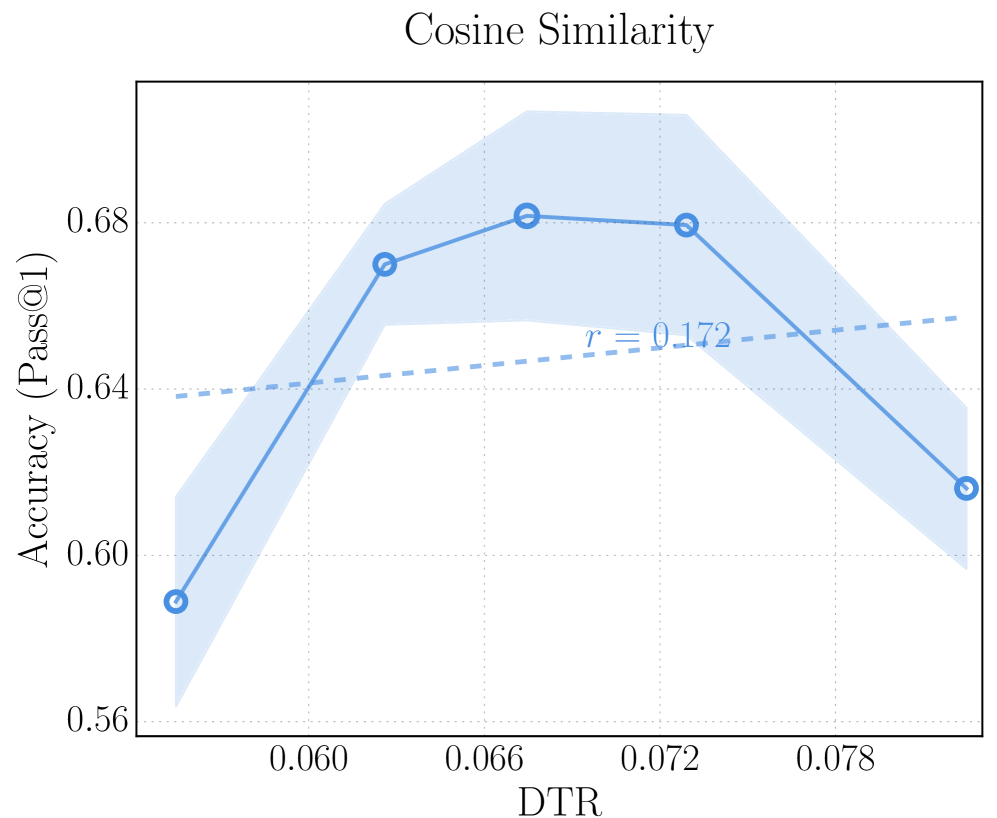
This image presents a line chart illustrating the relationship between DTR (likely Document Title Ratio or a similar metric) and Accuracy (Pass@1). A shaded region represents the confidence interval around the accuracy line. A dashed line represents a constant value for comparison. The chart title is "Cosine Similarity".
### Components/Axes
* **Title:** Cosine Similarity (centered at the top)
* **X-axis:** DTR (Document Title Ratio), ranging from approximately 0.060 to 0.078, with markers at 0.060, 0.066, 0.072, and 0.078.
* **Y-axis:** Accuracy (Pass@1), ranging from approximately 0.56 to 0.68, with markers at 0.56, 0.60, 0.64, 0.68.
* **Solid Line (Blue):** Represents the Accuracy (Pass@1) as a function of DTR.
* **Shaded Region (Light Blue):** Represents the confidence interval around the Accuracy line.
* **Dashed Line (Gray):** A horizontal line at approximately y = 0.64.
* **Text Annotation:** "r = 0.172" positioned near the dashed line, likely indicating a correlation coefficient.
### Detailed Analysis
The solid blue line representing Accuracy (Pass@1) shows an initial increase with increasing DTR, reaching a peak around DTR = 0.072, then a decrease as DTR increases further.
* **Point 1:** At DTR = 0.060, Accuracy is approximately 0.59.
* **Point 2:** At DTR = 0.066, Accuracy is approximately 0.67.
* **Point 3:** At DTR = 0.072, Accuracy is approximately 0.68.
* **Point 4:** At DTR = 0.078, Accuracy is approximately 0.61.
The confidence interval (shaded region) is wider around the peak (DTR = 0.072) and narrower at the extremes (DTR = 0.060 and 0.078). The dashed line remains constant at approximately 0.64. The correlation coefficient 'r' is 0.172, indicating a weak positive correlation.
### Key Observations
* Accuracy initially increases with DTR, suggesting that a higher Document Title Ratio improves accuracy up to a certain point.
* Beyond DTR = 0.072, increasing DTR leads to a decrease in Accuracy. This suggests an optimal DTR value exists.
* The confidence interval indicates uncertainty in the accuracy measurements, particularly around the peak.
* The correlation coefficient of 0.172 suggests a weak positive relationship between DTR and Accuracy.
### Interpretation
The chart demonstrates a non-linear relationship between DTR and Accuracy (Pass@1). Initially, a higher DTR correlates with improved accuracy, likely because a more descriptive or relevant document title provides more information for the model to assess. However, beyond a certain point, increasing DTR may introduce noise or irrelevant information, leading to a decrease in accuracy. The optimal DTR appears to be around 0.072.
The dashed line at 0.64 serves as a baseline for comparison. The accuracy values generally fluctuate around this baseline, with the peak exceeding it significantly. The weak correlation coefficient suggests that DTR is not a strong predictor of accuracy on its own, and other factors likely play a significant role. The confidence intervals highlight the variability in the accuracy measurements, indicating that the observed trends may not be statistically significant in all cases.