## Line Chart: Cosine Similarity vs Accuracy (Pass@1)
### Overview
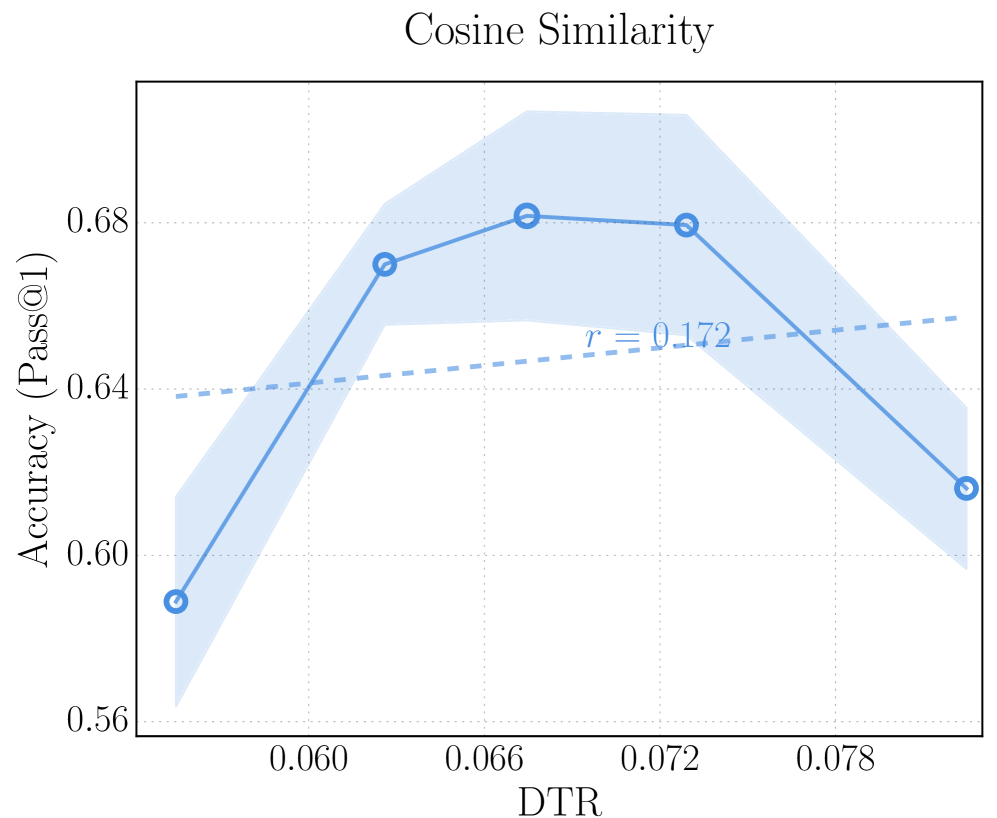
The chart illustrates the relationship between DTR (x-axis) and Accuracy (Pass@1) (y-axis) using a blue line with markers and a shaded confidence interval. A dashed reference line labeled with a correlation coefficient (r = 0.172) is overlaid. The data shows a non-linear trend with a peak in accuracy at mid-DTR values.
### Components/Axes
- **X-axis (DTR)**: Ranges from 0.060 to 0.078 in increments of 0.006. Labeled "DTR" with gridlines.
- **Y-axis (Accuracy)**: Ranges from 0.56 to 0.68 in increments of 0.02. Labeled "Accuracy (Pass@1)" with gridlines.
- **Legend**: No explicit legend, but the blue line represents the primary data series. The dashed line is annotated with "r = 0.172".
- **Shaded Area**: Light blue region surrounding the blue line, indicating variability or confidence intervals.
### Detailed Analysis
- **Blue Line Data Points**:
- At DTR = 0.060: Accuracy ≈ 0.59 (uncertainty: ±0.015, based on shaded area).
- At DTR = 0.066: Accuracy ≈ 0.68 (peak).
- At DTR = 0.072: Accuracy ≈ 0.68 (slight plateau).
- At DTR = 0.078: Accuracy ≈ 0.63 (decline).
- **Dashed Line**: Represents a weak linear trend (r = 0.172), suggesting minimal correlation between DTR and accuracy.
### Key Observations
1. **Non-linear Trend**: Accuracy increases sharply until DTR = 0.066, then plateaus and declines.
2. **Shaded Variability**: The shaded area indicates significant uncertainty, especially at lower DTR values (e.g., ±0.015 at DTR = 0.060).
3. **Weak Correlation**: The low r-value (0.172) implies the dashed line does not strongly represent the data's trend.
### Interpretation
The data suggests that higher DTR values initially improve accuracy, but beyond a threshold (DTR ≈ 0.066), performance degrades. The shaded area highlights model instability or dataset variability. The weak correlation (r = 0.172) indicates that DTR alone poorly predicts accuracy, implying other factors may influence the relationship. The peak at DTR = 0.066 could represent an optimal parameter setting, while the decline at higher DTR values might signal overfitting or diminishing returns.