## Scatter Plots: PCA Component Analysis for Token "deeper"
### Overview
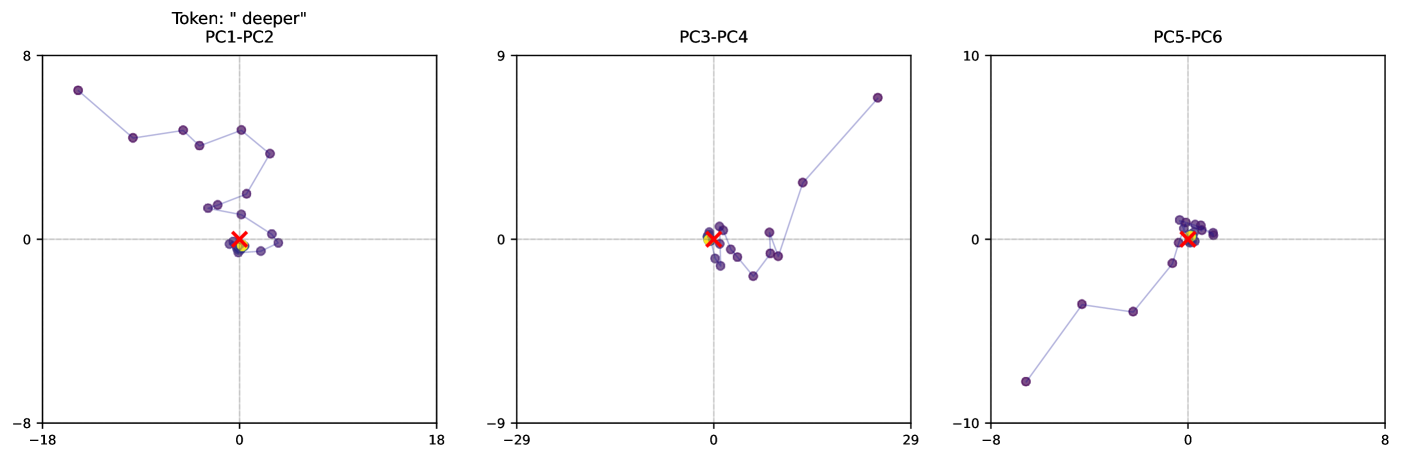
Three scatter plots visualize principal component (PC) relationships for the token "deeper" across three orthogonal component pairs: PC1-PC2, PC3-PC4, and PC5-PC6. Each plot shows data points (purple dots) and a red cross at the origin, with axes labeled with PC ranges and directional arrows.
### Components/Axes
1. **PC1-PC2 Plot**
- X-axis: PC1 (-18 to 18)
- Y-axis: PC2 (-8 to 8)
- Red cross at (0,0)
- Data points clustered near origin with spread along PC1
2. **PC3-PC4 Plot**
- X-axis: PC3 (-29 to 29)
- Y-axis: PC4 (-9 to 9)
- Red cross at (0,0)
- Data points show elongated distribution along PC3
3. **PC5-PC6 Plot**
- X-axis: PC5 (-8 to 8)
- Y-axis: PC6 (-10 to 10)
- Red cross at (0,0)
- Data points form tight cluster near origin
### Detailed Analysis
**PC1-PC2 Plot**
- Data points: 12 visible points
- Key positions:
- (-15, 5), (-12, 6), (-10, 7), (-8, 6), (-6, 5)
- (2, -3), (3, -2), (4, -1), (5, 0), (6, 1), (7, 2)
- Red cross at origin (0,0)
**PC3-PC4 Plot**
- Data points: 10 visible points
- Key positions:
- (-25, 3), (-22, 4), (-20, 5), (-18, 4), (-16, 3)
- (1, -4), (2, -3), (3, -2), (4, -1), (5, 0)
- Red cross at origin (0,0)
**PC5-PC6 Plot**
- Data points: 8 visible points
- Key positions:
- (-7, -9), (-5, -8), (-3, -7), (-1, -6)
- (1, -5), (3, -4), (5, -3), (7, -2)
- Red cross at origin (0,0)
### Key Observations
1. All plots show data points clustered around the origin with directional spread
2. PC1-PC2 shows strongest spread along PC1 axis (horizontal)
3. PC3-PC4 demonstrates most pronounced vertical distribution
4. PC5-PC6 has tightest clustering with minimal spread
5. Red cross consistently positioned at (0,0) in all plots
6. No visible legend or color-coded categories
### Interpretation
The PCA analysis reveals:
1. **Dimensional Structure**: Three orthogonal component pairs capture different aspects of the token's representation
2. **Variance Distribution**:
- PC1-PC2 shows highest variance along PC1 (horizontal spread)
- PC3-PC4 demonstrates significant vertical variance
- PC5-PC6 has minimal variance in both dimensions
3. **Token Representation**: The red cross at origin likely represents the mean/centroid position, with data points showing directional deviations
4. **Dimensional Independence**: The orthogonal nature of components suggests distinct feature spaces for each pair
The data suggests the token "deeper" has strongest representation in the PC1-PC2 space, with moderate representation in PC3-PC4 and minimal representation in PC5-PC6. The consistent origin marker across plots indicates a standardized reference point for comparison.