## Scatter Plots: Music Genre Embeddings
### Overview
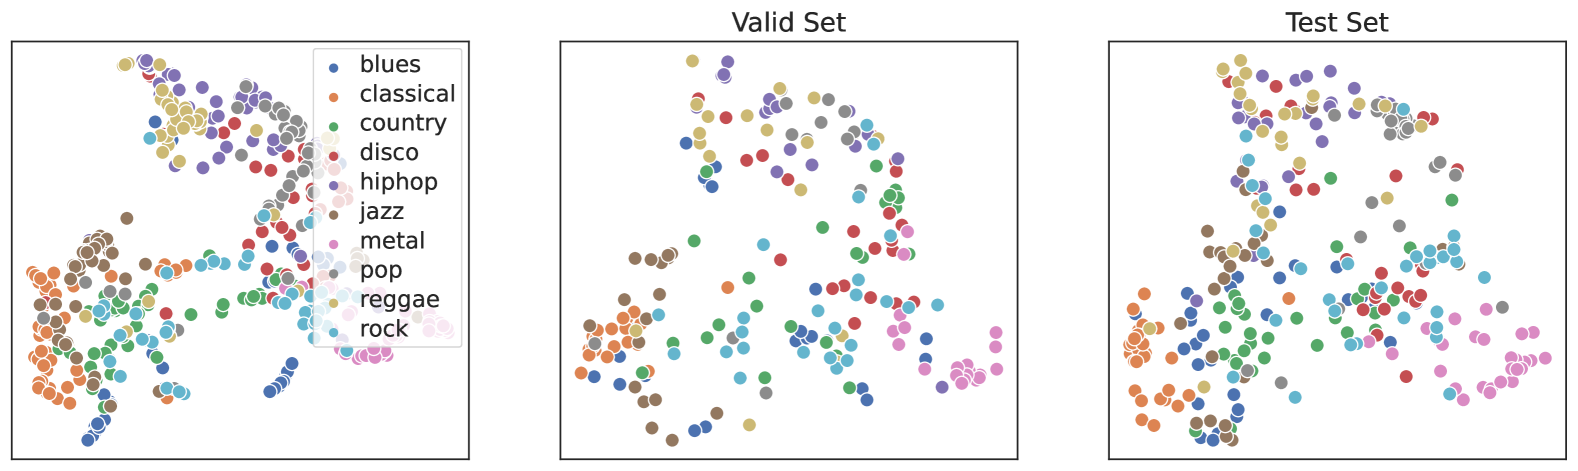
Three scatter plots visualize genre embeddings for a music classification model. Each plot represents a different dataset split: **Train Set** (left), **Valid Set** (center), and **Test Set** (right). Colored dots represent 10 music genres, with positions indicating learned feature representations. The legend (top-left) maps colors to genres.
### Components/Axes
- **Legend**: Positioned in the top-left corner of all plots, with 10 color-genre pairs:
- Blue: Blues
- Orange: Classical
- Green: Country
- Red: Disco
- Purple: Hip-hop
- Brown: Jazz
- Gray: Metal
- Pink: Pop
- Yellow: Reggae
- Light Blue: Rock
- **Axes**: Unlabeled x/y axes; positions are relative to plot boundaries.
- **Data Points**: Circular markers with no explicit scale or numerical values.
### Detailed Analysis
1. **Train Set**:
- **Blues** (blue): Clustered in the bottom-left quadrant.
- **Classical** (orange): Dominates the bottom-left, overlapping with blues.
- **Country** (green): Spread across the middle-left.
- **Disco** (red): Scattered in the middle-right.
- **Hip-hop** (purple): Concentrated in the top-right.
- **Jazz** (brown): Clustered in the middle-left.
- **Metal** (gray): Spread across the middle-right.
- **Pop** (pink): Dominates the top-right, overlapping with hip-hop.
- **Reggae** (yellow): Scattered in the middle-right.
- **Rock** (light blue): Clustered in the top-right.
2. **Valid Set**:
- Similar clustering patterns to the Train Set, but with slight dispersion:
- **Blues** and **Classical** remain tightly grouped in the bottom-left.
- **Pop** and **Hip-hop** show reduced overlap in the top-right.
- **Rock** (light blue) appears more dispersed than in the Train Set.
3. **Test Set**:
- **Blues** and **Classical** maintain bottom-left clustering.
- **Pop** (pink) and **Hip-hop** (purple) show increased separation in the top-right.
- **Rock** (light blue) forms a distinct cluster in the top-right, distinct from other genres.
- **Metal** (gray) and **Reggae** (yellow) exhibit greater dispersion compared to the Train/Valid Sets.
### Key Observations
- **Consistent Color Coding**: All plots use identical legend mappings, confirming genre consistency across datasets.
- **Cluster Stability**: Blues, Classical, and Rock maintain positional consistency across splits, suggesting robust genre separation.
- **Overlap Reduction**: Pop and Hip-hop show reduced overlap in the Test Set, indicating improved model discrimination.
- **Dispersion Trends**: Test Set clusters (e.g., Metal, Reggae) are more spread out, potentially reflecting generalization challenges.
### Interpretation
The scatter plots demonstrate how the model embeds music genres into a 2D space, with clusters reflecting genre similarities. The Train Set shows initial genre grouping, while the Valid and Test Sets reveal how well the model generalizes. The Test Set's increased separation between Pop/Hip-hop and Rock suggests the model can distinguish nuanced genre boundaries. However, the dispersion of Metal and Reggae in the Test Set may indicate underrepresentation or ambiguity in those genres. The absence of axis labels limits quantitative analysis but highlights the qualitative relationships between genres.