\n
## Bar Chart: Tasks Improved with KGOT Compared to HF Agents
### Overview
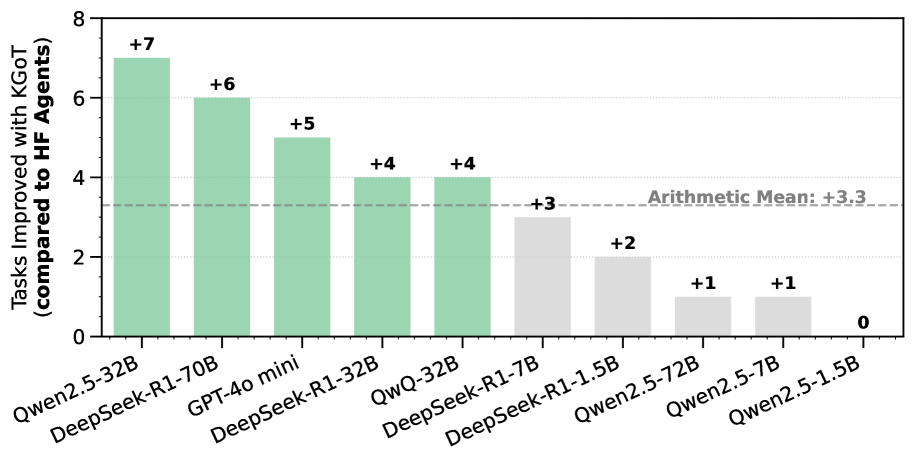
This is a vertical bar chart comparing the number of tasks improved with KGOT (Knowledge Graph Optimized Training) compared to HF (Hugging Face) Agents, across several different models. The y-axis represents the number of tasks improved, and the x-axis lists the model names. Each bar is labeled with the numerical improvement. A horizontal dashed line indicates the arithmetic mean of the improvements.
### Components/Axes
* **Y-axis Title:** "Tasks Improved with KGOT (compared to HF Agents)" - Scale ranges from 0 to 8, with increments of 1.
* **X-axis Labels:** Model names: "Qwen2.5-32B", "DeepSeek-R1-70B", "GPT-4o mini", "DeepSeek-R1-32B", "QWQ-32B", "DeepSeek-R1-7B", "DeepSeek-R1-1.5B", "Qwen2.5-72B", "Qwen2.5-7B", "Qwen2.5-1.5B".
* **Horizontal Line:** "Arithmetic Mean: +3.3" - A dashed grey line at approximately y = 3.3.
* **Bar Colors:** The bars are predominantly a shade of green, with the last three bars being a lighter grey.
* **Bar Labels:** Each bar is labeled with a numerical value indicating the improvement.
### Detailed Analysis
The chart displays the following data points:
* **Qwen2.5-32B:** +7 tasks improved. (Dark Green)
* **DeepSeek-R1-70B:** +6 tasks improved. (Dark Green)
* **GPT-4o mini:** +5 tasks improved. (Dark Green)
* **DeepSeek-R1-32B:** +4 tasks improved. (Dark Green)
* **QWQ-32B:** +4 tasks improved. (Dark Green)
* **DeepSeek-R1-7B:** +3 tasks improved. (Dark Green)
* **DeepSeek-R1-1.5B:** +2 tasks improved. (Light Grey)
* **Qwen2.5-72B:** +1 task improved. (Light Grey)
* **Qwen2.5-7B:** +1 task improved. (Light Grey)
* **Qwen2.5-1.5B:** 0 tasks improved. (Light Grey)
The bars generally decrease in height from left to right, with a noticeable shift in color from dark green to light grey around the "DeepSeek-R1-1.5B" model. The trend is a decreasing number of tasks improved as you move from left to right across the models.
### Key Observations
* The models Qwen2.5-32B, DeepSeek-R1-70B, and GPT-4o mini show the highest improvements with KGOT.
* The models Qwen2.5-1.5B, Qwen2.5-7B, and Qwen2.5-72B show minimal or no improvement with KGOT.
* The arithmetic mean of +3.3 provides a baseline for comparison. Most models outperform this mean, while the last three underperform.
* There is a clear distinction between the models that benefit significantly from KGOT (dark green) and those that do not (light grey).
### Interpretation
The data suggests that KGOT is more effective for certain models than others. Larger models (Qwen2.5-32B, DeepSeek-R1-70B) appear to benefit the most from KGOT, while smaller models (Qwen2.5-1.5B, Qwen2.5-7B, Qwen2.5-72B) show little to no improvement. This could indicate that KGOT is particularly useful for models with a larger capacity to leverage the knowledge graph information. The shift in bar color likely signifies a threshold or categorization of model performance with KGOT. The arithmetic mean provides a useful reference point, highlighting which models are above or below average in terms of improvement. The data implies that KGOT is not a universally beneficial technique and its effectiveness is dependent on the underlying model architecture and size.