## Bar Chart: Tasks Improved with HF Agents (compared to KGoT)
### Overview
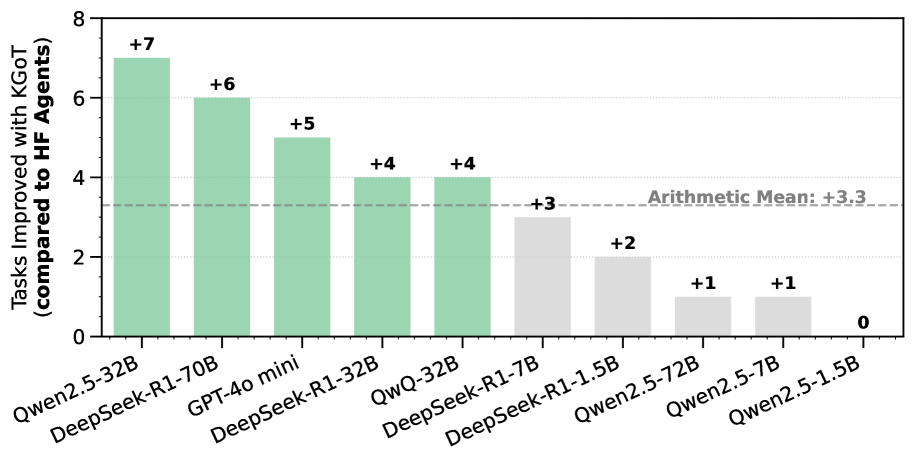
The chart compares the performance improvement of various AI models when using HF (High-Fidelity) agents versus KGoT (Knowledge-Guided Optimization Techniques). The y-axis represents the number of tasks improved, while the x-axis lists different AI models. Green bars indicate positive improvements, gray bars show lower improvements, and a dashed line marks the arithmetic mean improvement of +3.3.
### Components/Axes
- **Title**: "Tasks Improved with HF Agents (compared to KGoT)"
- **X-axis (Categories)**:
- Qwen2.5-32B
- DeepSeek-R1-70B
- GPT-40 mini
- DeepSeek-R1-32B
- QwQ-32B
- DeepSeek-R1-1.7B
- DeepSeek-R1-1.5B
- Qwen2.5-72B
- Qwen2.5-7B
- Qwen2.5-1.5B
- **Y-axis (Values)**:
- Labeled "Tasks Improved with HF Agents (compared to KGoT)"
- Scale ranges from 0 to 8 in increments of 1.
- **Legend**: Not explicitly labeled, but colors are used to differentiate performance tiers:
- **Green**: Higher improvements (+4 to +7)
- **Gray**: Lower improvements (+0 to +3)
- **Arithmetic Mean**: A dashed horizontal line at +3.3.
### Detailed Analysis
- **Qwen2.5-32B**: Green bar with +7 tasks improved (highest value).
- **DeepSeek-R1-70B**: Green bar with +6 tasks improved.
- **GPT-40 mini**: Green bar with +5 tasks improved.
- **DeepSeek-R1-32B**: Green bar with +4 tasks improved.
- **QwQ-32B**: Green bar with +4 tasks improved.
- **DeepSeek-R1-1.7B**: Gray bar with +3 tasks improved.
- **DeepSeek-R1-1.5B**: Gray bar with +2 tasks improved.
- **Qwen2.5-72B**: Gray bar with +1 task improved.
- **Qwen2.5-7B**: Gray bar with +1 task improved.
- **Qwen2.5-1.5B**: Gray bar with 0 tasks improved (lowest value).
### Key Observations
1. **Performance Gradient**: Larger models (e.g., 32B, 70B) generally show higher task improvements, while smaller models (e.g., 1.5B, 1.7B) perform worse.
2. **Arithmetic Mean Context**: The dashed line at +3.3 indicates that models above this threshold (green bars) outperform the average, while those below (gray bars) underperform.
3. **Outlier**: Qwen2.5-1.5B shows no improvement (0 tasks), suggesting it may be the least effective model in this comparison.
4. **Color Coding**: Green bars dominate the upper half of the chart, while gray bars occupy the lower half, visually reinforcing the performance gradient.
### Interpretation
The data suggests that model size correlates with task improvement when using HF agents. Larger models (e.g., Qwen2.5-32B, DeepSeek-R1-70B) achieve significantly higher improvements compared to smaller models (e.g., Qwen2.5-1.5B). The arithmetic mean of +3.3 serves as a benchmark, highlighting that models above this line (green) are more effective than the average, while those below (gray) lag behind. The absence of improvement for Qwen2.5-1.5B raises questions about its architecture or training data suitability for the evaluated tasks. The color coding (green vs. gray) effectively communicates performance tiers, though an explicit legend would enhance clarity.