## Diagram: Logic Grid Interface
### Overview
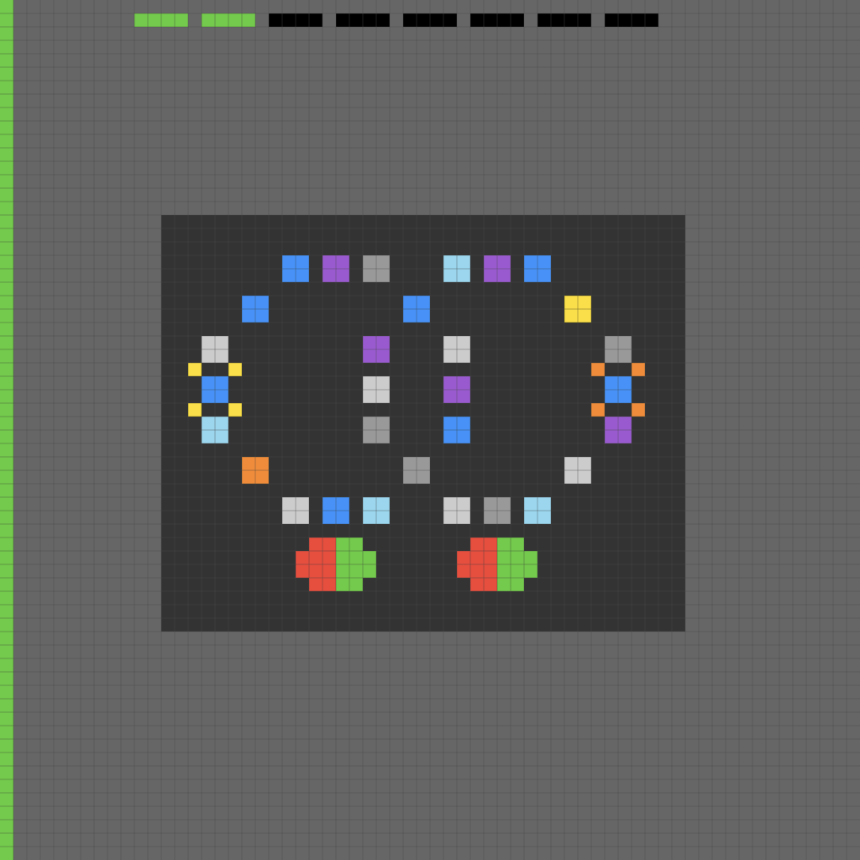
The image displays a digital interface, likely from a puzzle or logic-based software application. The background is a dark grey grid. The interface features a central rectangular area containing a symmetrical arrangement of colored squares forming two interlocking loops, with status indicators located along the top and left edges of the screen.
### Components/Axes
* **Top Status Bar:** A horizontal row of 10 rectangular slots. The first two slots (leftmost) are filled with green; the remaining eight slots are filled with black/dark grey.
* **Left Status Bar:** A continuous vertical column of green blocks running along the left edge of the image.
* **Main Display Area:** A centered, dark grey rectangular container.
* **Central Pattern:** Two interlocking loops composed of colored squares (light blue, purple, grey, yellow, orange).
* **Bottom Nodes:** Two circular icons positioned at the base of the interlocking loops, each split vertically into a red half and a green half.
### Detailed Analysis
The central pattern is arranged within the dark grey rectangle. The arrangement appears to be two interlocking loops, though the composition is asymmetrical in its color distribution:
* **Left Loop Structure:**
* **Top Arc:** Composed of three squares: Light Blue, Purple, and Grey.
* **Left Arc:** Composed of three squares: Yellow, Blue, and Light Blue.
* **Bottom:** A single Orange square.
* **Center/Intersection:** A vertical column of three Grey squares.
* **Right Loop Structure:**
* **Top Arc:** Composed of three squares: Light Blue, Purple, and Blue.
* **Right Arc:** Composed of five squares: Yellow, Grey, Orange, Blue, and Purple.
* **Bottom:** A single Grey square.
* **Bottom Nodes:**
* Located below the loops, there are two circular elements.
* **Left Node:** Split vertically, with the left half Red and the right half Green.
* **Right Node:** Split vertically, with the left half Red and the right half Green.
### Key Observations
* **Symmetry vs. Asymmetry:** While the overall shape of the two loops is roughly symmetrical, the color distribution is not. The right loop contains a higher density of colored squares (5 in the right arc) compared to the left loop (3 in the left arc).
* **Color Coding:** The colors (Light Blue, Purple, Grey, Yellow, Orange, Blue) likely represent specific variables, states, or puzzle pieces.
* **Status Indicators:** The green bars on the top and left suggest a "health," "energy," or "progress" metric, indicating that the user has a limited resource or is tracking a specific value.
* **Interlocking Design:** The shared central column of grey squares suggests a dependency or intersection between the two loops, typical of Venn diagram-style logic puzzles.
### Interpretation
This image is characteristic of a logic puzzle interface. The interlocking loops suggest that the user must manipulate the colored squares to satisfy a condition where the two loops interact. The red/green circular nodes at the bottom likely function as "submit" or "toggle" buttons, where the red/green split might indicate a binary state (e.g., "incorrect/correct" or "off/on"). The green bars on the periphery act as a constraint mechanism, implying that the user has a limited number of moves or a specific resource limit to complete the puzzle. The lack of text suggests a language-independent, icon-based UI design.