## Scatter Plot: Confidence vs Target Length in Clinical Knowledge
### Overview
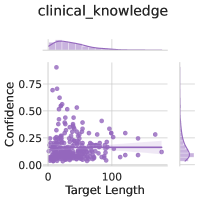
The image displays a scatter plot titled "clinical_knowledge" analyzing the relationship between "Target Length" (x-axis) and "Confidence" (y-axis). Purple data points are distributed across the plot, with a horizontal reference line at approximately 0.25 confidence. Marginal density plots (top) and histograms (right) provide additional distributional context.
### Components/Axes
- **Title**: `clinical_knowledge`
- **X-axis**: "Target Length" (scale: 0 to 100, linear)
- **Y-axis**: "Confidence" (scale: 0.00 to 0.75, linear)
- **Reference Line**: Horizontal dashed line at y ≈ 0.25
- **Marginal Plots**:
- Top: Density plot of confidence values (peaks near 0.25)
- Right: Histogram of target lengths (peaks at lower values)
### Detailed Analysis
- **Data Points**:
- Most points cluster below y = 0.25, with a few outliers reaching up to y ≈ 0.75.
- Confidence decreases as target length increases, though variability exists (e.g., some high-confidence points at low target lengths).
- **Marginal Plots**:
- Confidence density peaks sharply at ~0.25, with a long tail toward lower values.
- Target length histogram shows a right-skewed distribution, with most values concentrated below 50.
### Key Observations
1. **Negative Correlation**: Higher target lengths generally correspond to lower confidence, though exceptions exist.
2. **Threshold Effect**: The horizontal line at 0.25 may represent a critical confidence threshold (e.g., minimum acceptable performance).
3. **Distribution Skew**: Both confidence and target length distributions are skewed toward lower values, suggesting a focus on shorter targets or lower-confidence scenarios.
### Interpretation
The data implies that longer clinical knowledge targets are associated with reduced confidence, potentially indicating challenges in handling complex or extended information. The 0.25 confidence threshold could signify a performance benchmark, with most data points failing to meet this standard. The marginal plots reinforce this, showing a concentration of low-confidence, short-target scenarios. This might reflect limitations in clinical knowledge systems when processing extended or nuanced information, highlighting a need for optimization in handling longer targets.