## Scatter Plot: clinical_knowledge
### Overview
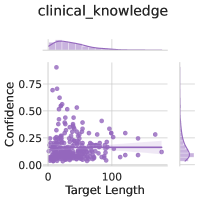
The image is a scatter plot titled "clinical_knowledge". It displays the relationship between "Target Length" on the x-axis and "Confidence" on the y-axis. The plot includes a regression line and marginal density plots along each axis. All data points and lines are colored in a shade of purple.
### Components/Axes
* **Title:** clinical\_knowledge
* **X-axis:**
* Label: Target Length
* Scale: Approximately 0 to 200
* **Y-axis:**
* Label: Confidence
* Scale: 0.00 to 0.75
* **Data Points:** Purple dots scattered across the plot.
* **Regression Line:** A purple line showing the trend of the data.
* **Marginal Density Plots:** Purple density plots along the x and y axes, showing the distribution of data points.
### Detailed Analysis
* **X-axis (Target Length):** Ranges from approximately 0 to 200.
* **Y-axis (Confidence):** Ranges from 0.00 to 0.75.
* **Data Points:**
* A large cluster of points is concentrated near the lower-left corner, indicating many data points have low target length and low confidence.
* As target length increases, the confidence values appear to spread out more vertically.
* **Regression Line:** The regression line is nearly horizontal, suggesting a weak or negligible correlation between target length and confidence. The line appears to be at approximately 0.15 confidence.
* **Marginal Density Plots:**
* The density plot along the x-axis shows a high concentration of data points at lower target lengths.
* The density plot along the y-axis shows a peak at lower confidence values, with a long tail extending towards higher confidence values.
### Key Observations
* Most data points have low target length and low confidence.
* There is a weak or negligible correlation between target length and confidence, as indicated by the nearly horizontal regression line.
* The distribution of target lengths is skewed towards lower values.
* The distribution of confidence values is also skewed towards lower values.
### Interpretation
The scatter plot suggests that, for the "clinical_knowledge" dataset, there is little to no relationship between the length of the target and the confidence level. The high concentration of points at low target length and low confidence indicates that many instances fall into this category. The weak regression line reinforces the lack of a strong correlation. The marginal density plots confirm that both target length and confidence are generally low, with a few instances of higher values. This could imply that the model or system being evaluated struggles with longer targets, or that the confidence is generally low regardless of target length. Further analysis would be needed to determine the underlying reasons for this pattern.