## Histogram: Price and Duration Distributions of GPT-4o
### Overview
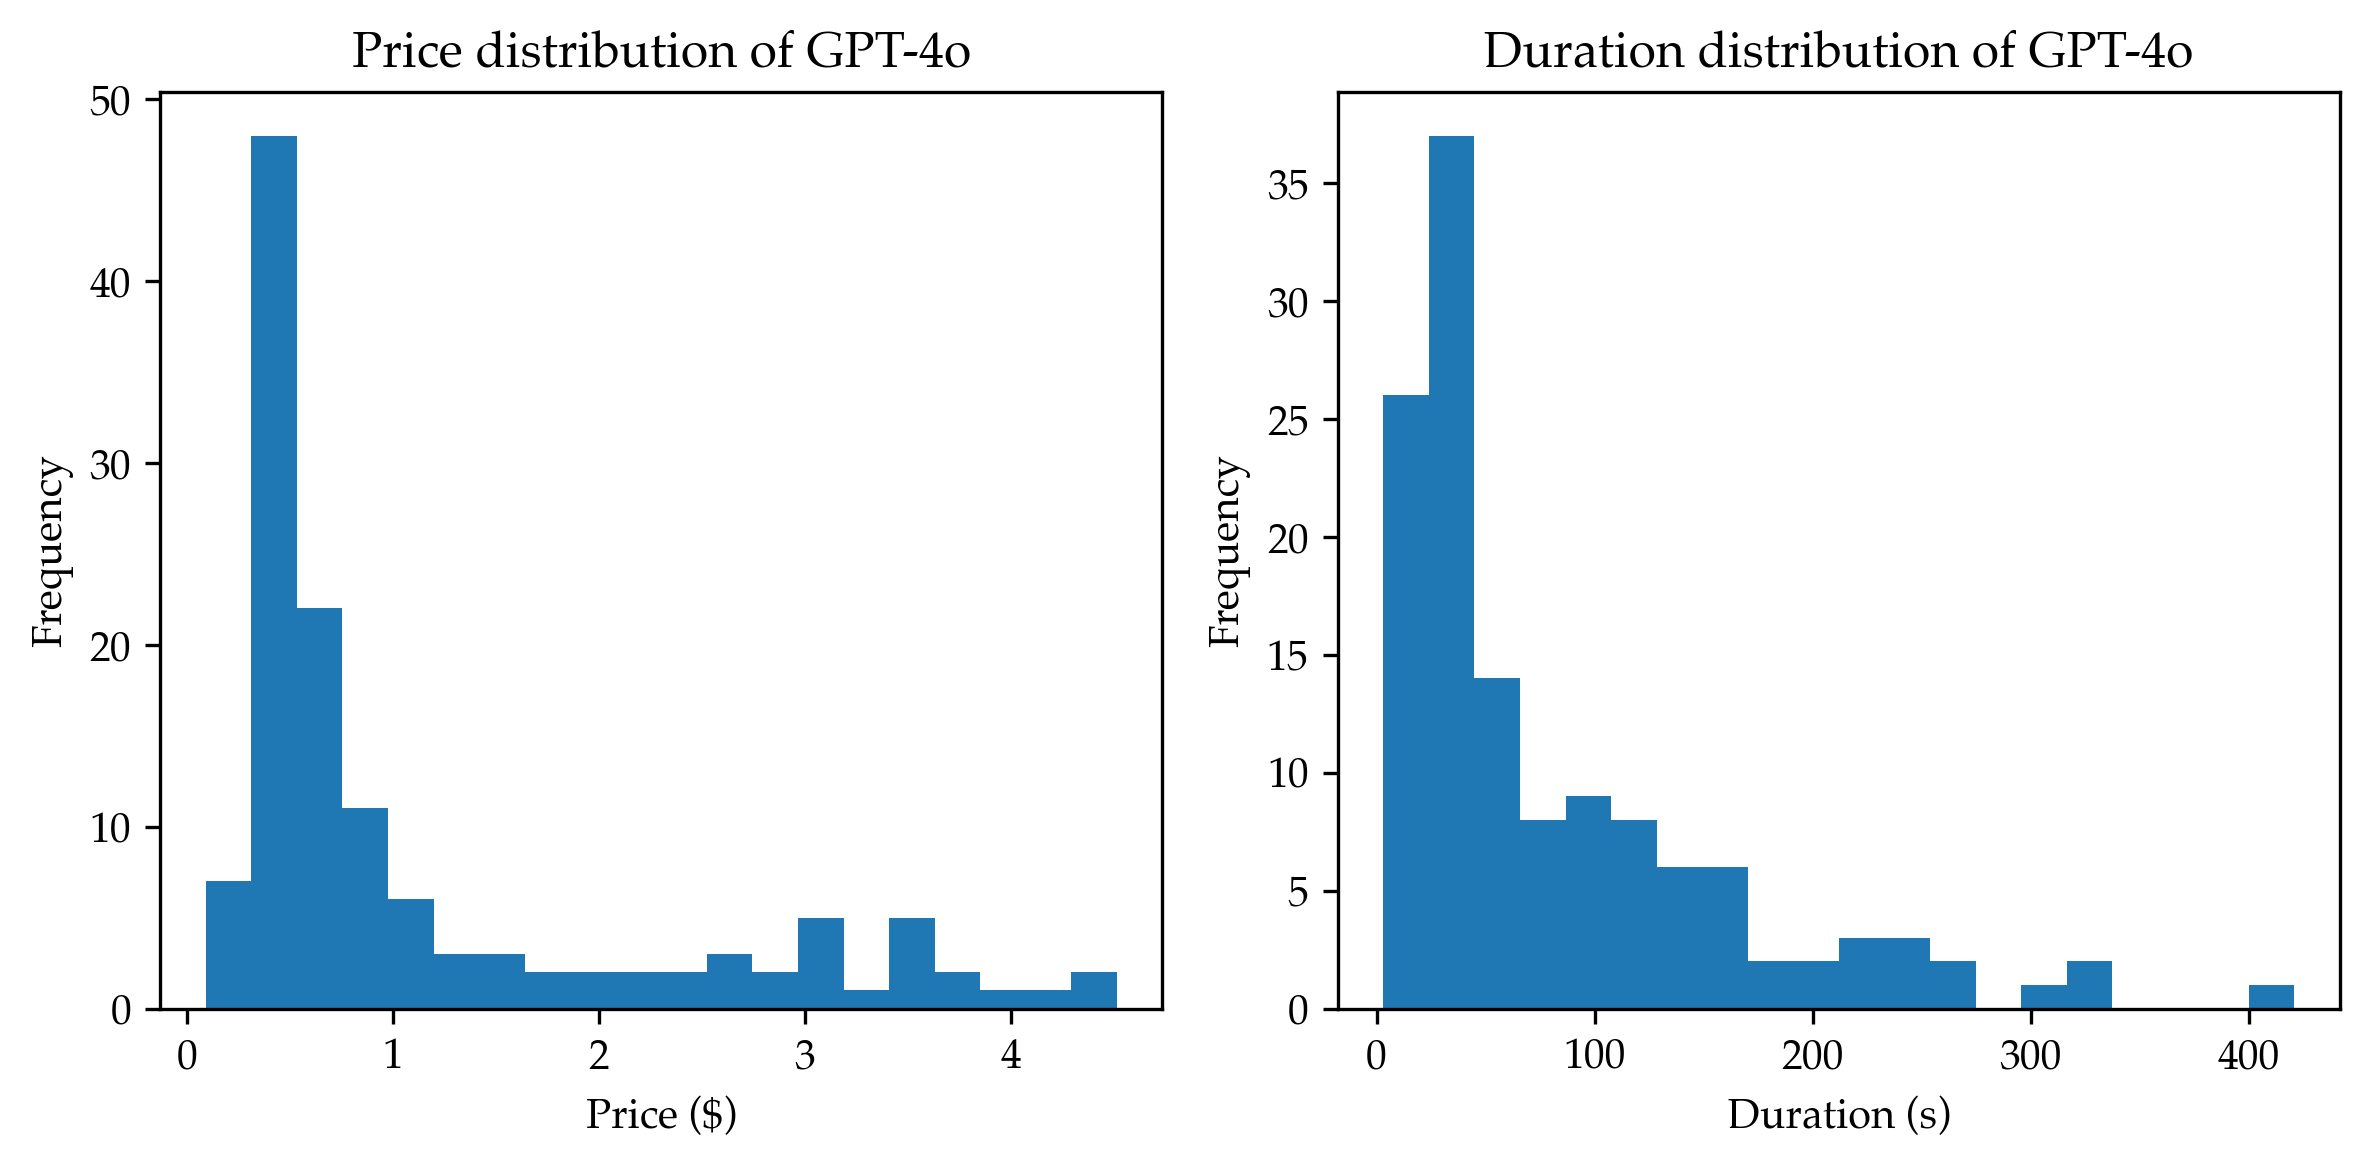
The image presents two histograms side-by-side. The left histogram displays the price distribution of GPT-4o, while the right histogram shows the duration distribution of GPT-4o. Both histograms use frequency on the y-axis and price (in dollars) or duration (in seconds) on the x-axis.
### Components/Axes
**Left Histogram (Price Distribution):**
* **Title:** Price distribution of GPT-4o
* **X-axis:** Price ($)
* Scale: 0 to 4, with tick marks at every integer value (0, 1, 2, 3, 4)
* **Y-axis:** Frequency
* Scale: 0 to 50, with tick marks at intervals of 10 (0, 10, 20, 30, 40, 50)
* **Bars:** The histogram bars are blue.
**Right Histogram (Duration Distribution):**
* **Title:** Duration distribution of GPT-4o
* **X-axis:** Duration (s)
* Scale: 0 to 400, with tick marks at intervals of 100 (0, 100, 200, 300, 400)
* **Y-axis:** Frequency
* Scale: 0 to 35, with tick marks at intervals of 5 (0, 5, 10, 15, 20, 25, 30, 35)
* **Bars:** The histogram bars are blue.
### Detailed Analysis
**Left Histogram (Price Distribution):**
* **Trend:** The distribution is heavily skewed to the right, indicating that most GPT-4o prices are low, with a few instances of higher prices.
* **Data Points:**
* Price 0-1: Frequency approximately 48
* Price 1-2: Frequency approximately 22
* Price 2-3: Frequency approximately 11
* Price 3-4: Frequency approximately 6
* Price 4-5: Frequency approximately 2
**Right Histogram (Duration Distribution):**
* **Trend:** The distribution is heavily skewed to the right, indicating that most GPT-4o durations are short, with a few instances of longer durations.
* **Data Points:**
* Duration 0-50: Frequency approximately 37
* Duration 50-100: Frequency approximately 26
* Duration 100-150: Frequency approximately 14
* Duration 150-200: Frequency approximately 8
* Duration 200-250: Frequency approximately 8
* Duration 250-300: Frequency approximately 6
* Duration 300-350: Frequency approximately 2
* Duration 350-400: Frequency approximately 1
### Key Observations
* Both distributions are right-skewed, indicating that lower prices and shorter durations are more common.
* The price distribution has a peak at the lowest price range (0-1), while the duration distribution has a peak at the lowest duration range (0-50).
* The frequency decreases as price and duration increase.
### Interpretation
The histograms suggest that GPT-4o is typically used for short tasks that cost relatively little. The right skew in both distributions indicates that while there are instances of longer, more expensive tasks, they are less frequent. This could be due to the nature of the tasks being performed, the pricing model of GPT-4o, or user behavior. The data implies that most users are leveraging GPT-4o for quick, inexpensive operations.