\n
## Histograms: Price and Duration Distribution of GPT-4o
### Overview
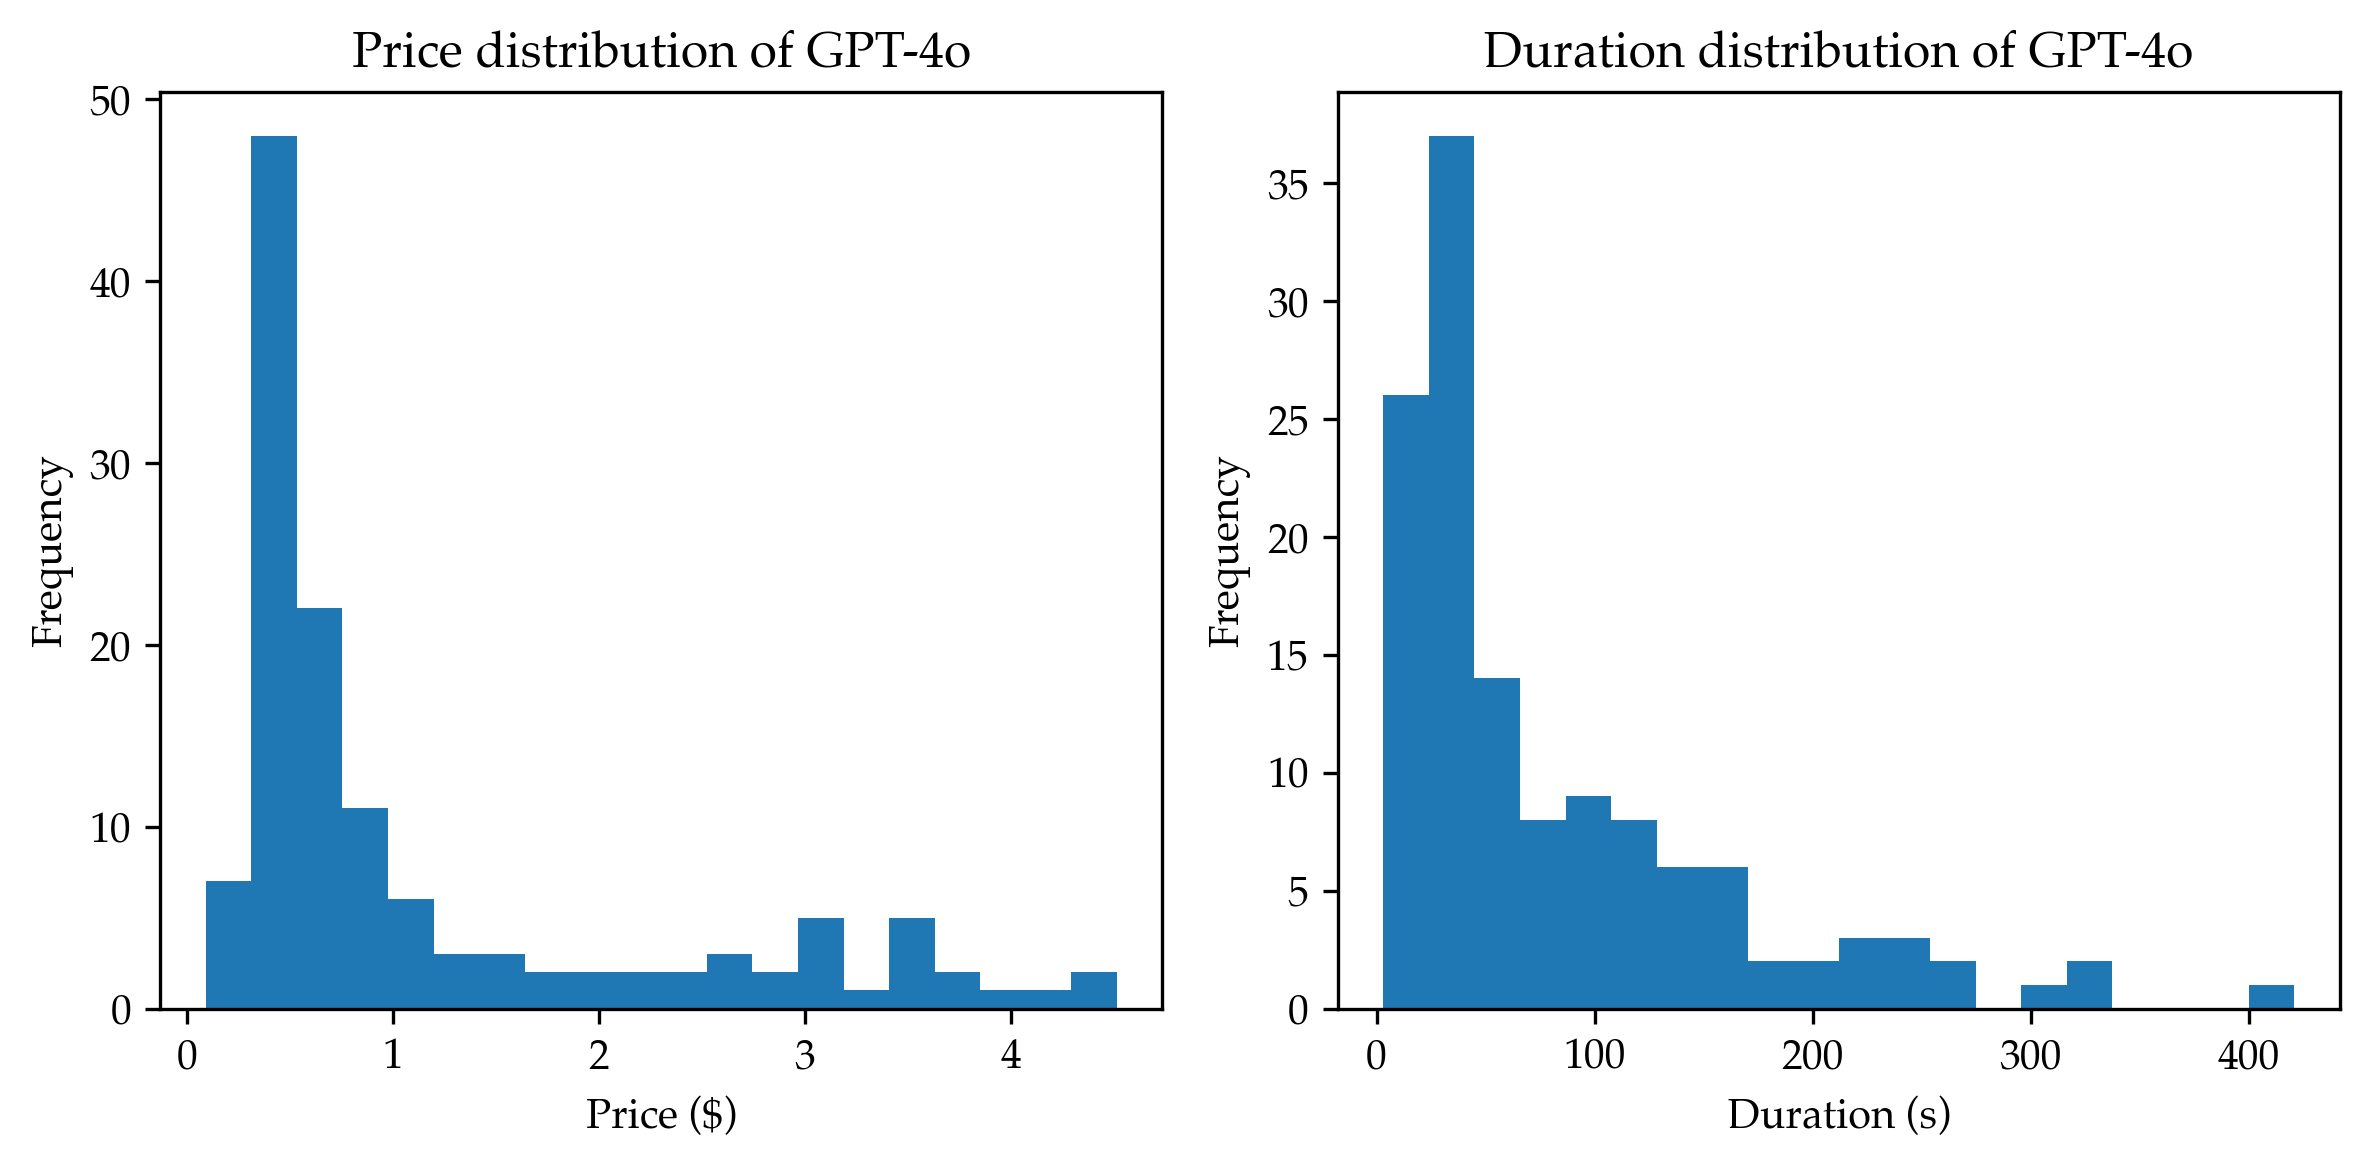
The image presents two histograms displayed side-by-side. The left histogram shows the price distribution of GPT-4o, while the right histogram shows its duration distribution. Both histograms use frequency as the y-axis and represent the distribution of data points within defined bins.
### Components/Axes
* **Left Histogram (Price Distribution):**
* Title: "Price distribution of GPT-4o"
* X-axis Label: "Price ($)"
* Y-axis Label: "Frequency"
* X-axis Scale: Ranges from approximately 0 to 4, with tick marks at 0, 1, 2, 3, and 4.
* Y-axis Scale: Ranges from 0 to 50, with tick marks at intervals of 5.
* **Right Histogram (Duration Distribution):**
* Title: "Duration distribution of GPT-4o"
* X-axis Label: "Duration (s)"
* Y-axis Label: "Frequency"
* X-axis Scale: Ranges from approximately 0 to 400, with tick marks at intervals of 100.
* Y-axis Scale: Ranges from 0 to 35, with tick marks at intervals of 5.
### Detailed Analysis or Content Details
* **Left Histogram (Price Distribution):**
* The distribution is heavily skewed to the left.
* The highest frequency occurs between approximately $0 and $0.5, with a frequency of around 48.
* There is a significant drop in frequency as the price increases.
* A secondary peak is observed between approximately $1.5 and $2, with a frequency of around 10.
* There are a few data points with prices between $3 and $4, with frequencies around 2-3.
* **Right Histogram (Duration Distribution):**
* The distribution is also skewed to the right.
* The highest frequency occurs between approximately 0 and 50 seconds, with a frequency of around 35.
* The frequency decreases as the duration increases.
* A secondary peak is observed between approximately 100 and 150 seconds, with a frequency of around 8.
* There are a few data points with durations between 300 and 400 seconds, with frequencies around 1-2.
### Key Observations
* The price of GPT-4o is predominantly low, with the majority of instances costing less than $0.50.
* The duration of GPT-4o usage is also generally short, with most instances lasting less than 50 seconds.
* Both distributions exhibit a long tail, indicating the presence of some instances with higher prices and longer durations.
* The price distribution has a more pronounced secondary peak than the duration distribution.
### Interpretation
The data suggests that GPT-4o is typically used for short, inexpensive tasks. The high frequency of low-price and short-duration instances indicates that it is well-suited for quick interactions or simple queries. The presence of longer durations and higher prices suggests that it can also be used for more complex tasks, but these are less common. The skewness of both distributions indicates that the typical use case is towards the lower end of both price and duration. The secondary peaks may represent distinct types of usage patterns or tasks. The data could be used to optimize pricing strategies or to identify areas for improving the efficiency of GPT-4o.