## Histograms: Price and Duration Distributions of GPT-4o
### Overview
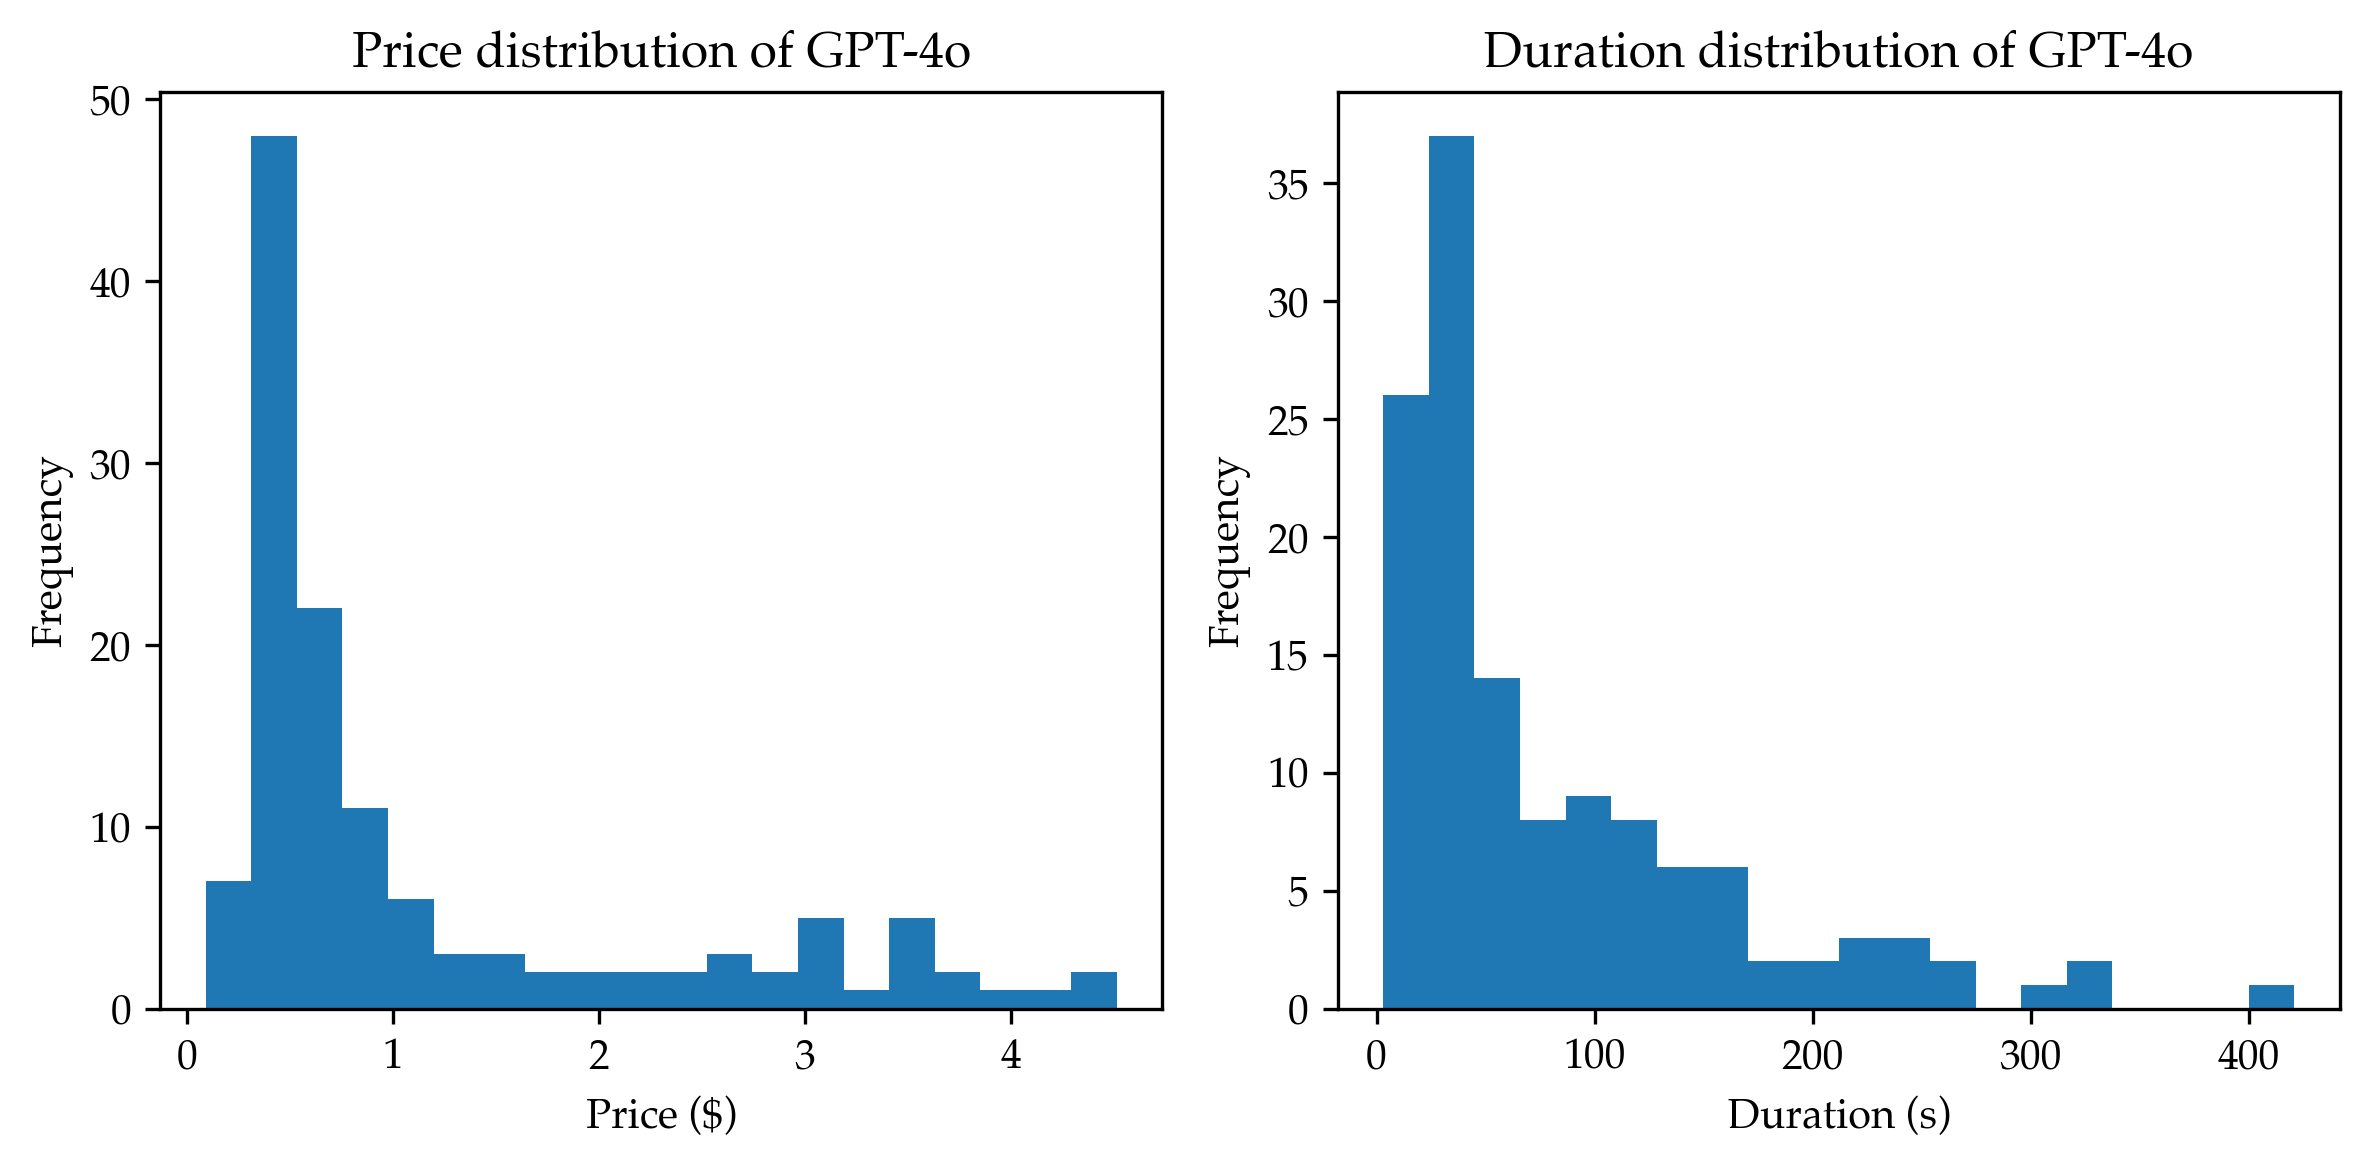
The image displays two side-by-side histograms presenting statistical distributions for the GPT-4o model. The left histogram shows the distribution of price in US dollars ($), and the right histogram shows the distribution of duration in seconds (s). Both charts share a similar visual style with blue bars on a white background, using frequency as the vertical measure.
### Components/Axes
**Left Histogram:**
* **Title:** "Price distribution of GPT-4o" (centered at the top).
* **X-axis:** Labeled "Price ($)". The axis has major tick marks and numerical labels at 0, 1, 2, 3, and 4.
* **Y-axis:** Labeled "Frequency". The axis has major tick marks and numerical labels at 0, 10, 20, 30, 40, and 50.
**Right Histogram:**
* **Title:** "Duration distribution of GPT-4o" (centered at the top).
* **X-axis:** Labeled "Duration (s)". The axis has major tick marks and numerical labels at 0, 100, 200, 300, and 400.
* **Y-axis:** Labeled "Frequency". The axis has major tick marks and numerical labels at 0, 5, 10, 15, 20, 25, 30, and 35.
**Spatial Layout:** The two histograms are positioned horizontally adjacent. The price histogram occupies the left half of the image, and the duration histogram occupies the right half. There is no shared legend, as each chart is a single data series.
### Detailed Analysis
**Price Distribution (Left Chart):**
The distribution is strongly right-skewed, with the vast majority of data points concentrated at the lower end of the price scale.
* **Peak:** The highest frequency bar is located in the bin approximately between $0.4 and $0.6, with a frequency of approximately 48.
* **Adjacent Bins:** The bin to the left (approx. $0.2-$0.4) has a frequency of ~7. The bin to the right (approx. $0.6-$0.8) has a frequency of ~22.
* **Tail:** Frequencies drop sharply after $1.0. There is a long, sparse tail extending to $4.5, with small, intermittent bars (frequencies between ~1 and ~5) visible in the $2.5 to $4.5 range.
**Duration Distribution (Right Chart):**
This distribution is also right-skewed, with most durations clustered at the lower end.
* **Peak:** The highest frequency bar is located in the bin approximately between 40 and 60 seconds, with a frequency of approximately 37.
* **Adjacent Bins:** The bin to the left (approx. 20-40s) has a frequency of ~26. The bin to the right (approx. 60-80s) has a frequency of ~14.
* **Tail:** Frequencies decline steadily after 80 seconds. A sparse tail extends to 420 seconds, with very low-frequency bars (frequencies of ~1-3) appearing intermittently beyond 200 seconds.
### Key Observations
1. **Strong Right Skew:** Both price and duration exhibit classic right-skewed (positive-skew) distributions. The mode (most common value) is at the low end for both metrics.
2. **Concentration of Data:** The bulk of the data (the "body" of the distribution) for price is below $1.0, and for duration is below 100 seconds.
3. **Presence of Outliers:** Both charts show a long tail, indicating the presence of outlier instances with significantly higher prices (up to ~$4.5) and longer durations (up to ~420 seconds), though these are rare.
4. **Similar Shape:** The two distributions share a nearly identical morphological shape, suggesting a potential correlation between the price and duration of GPT-4o tasks or queries in this dataset.
### Interpretation
The data suggests that the cost (price) and processing time (duration) for GPT-4o are not normally distributed but follow a pattern common to many service-based metrics: most interactions are quick and inexpensive, while a small subset are significantly more resource-intensive.
* **Operational Insight:** The high concentration of low-duration tasks implies the model is frequently used for relatively brief interactions. The corresponding concentration at low prices indicates these brief tasks are also low-cost.
* **Correlation Implication:** The striking similarity in distribution shapes strongly hints that duration is a primary driver of price. Longer tasks likely consume more computational resources, leading to higher costs. The outliers represent the "heavy tail" of complex, time-consuming, and therefore expensive requests.
* **Planning & Forecasting:** For users or system planners, this means budgeting and capacity planning can be based on the high-probability, low-value cluster, but must also account for the low-probability, high-impact outliers that can disproportionately affect total cost and latency. The distributions provide a quantitative basis for setting expectations and service-level agreements.