## Histograms: Price and Duration Distribution of GPT-4o
### Overview
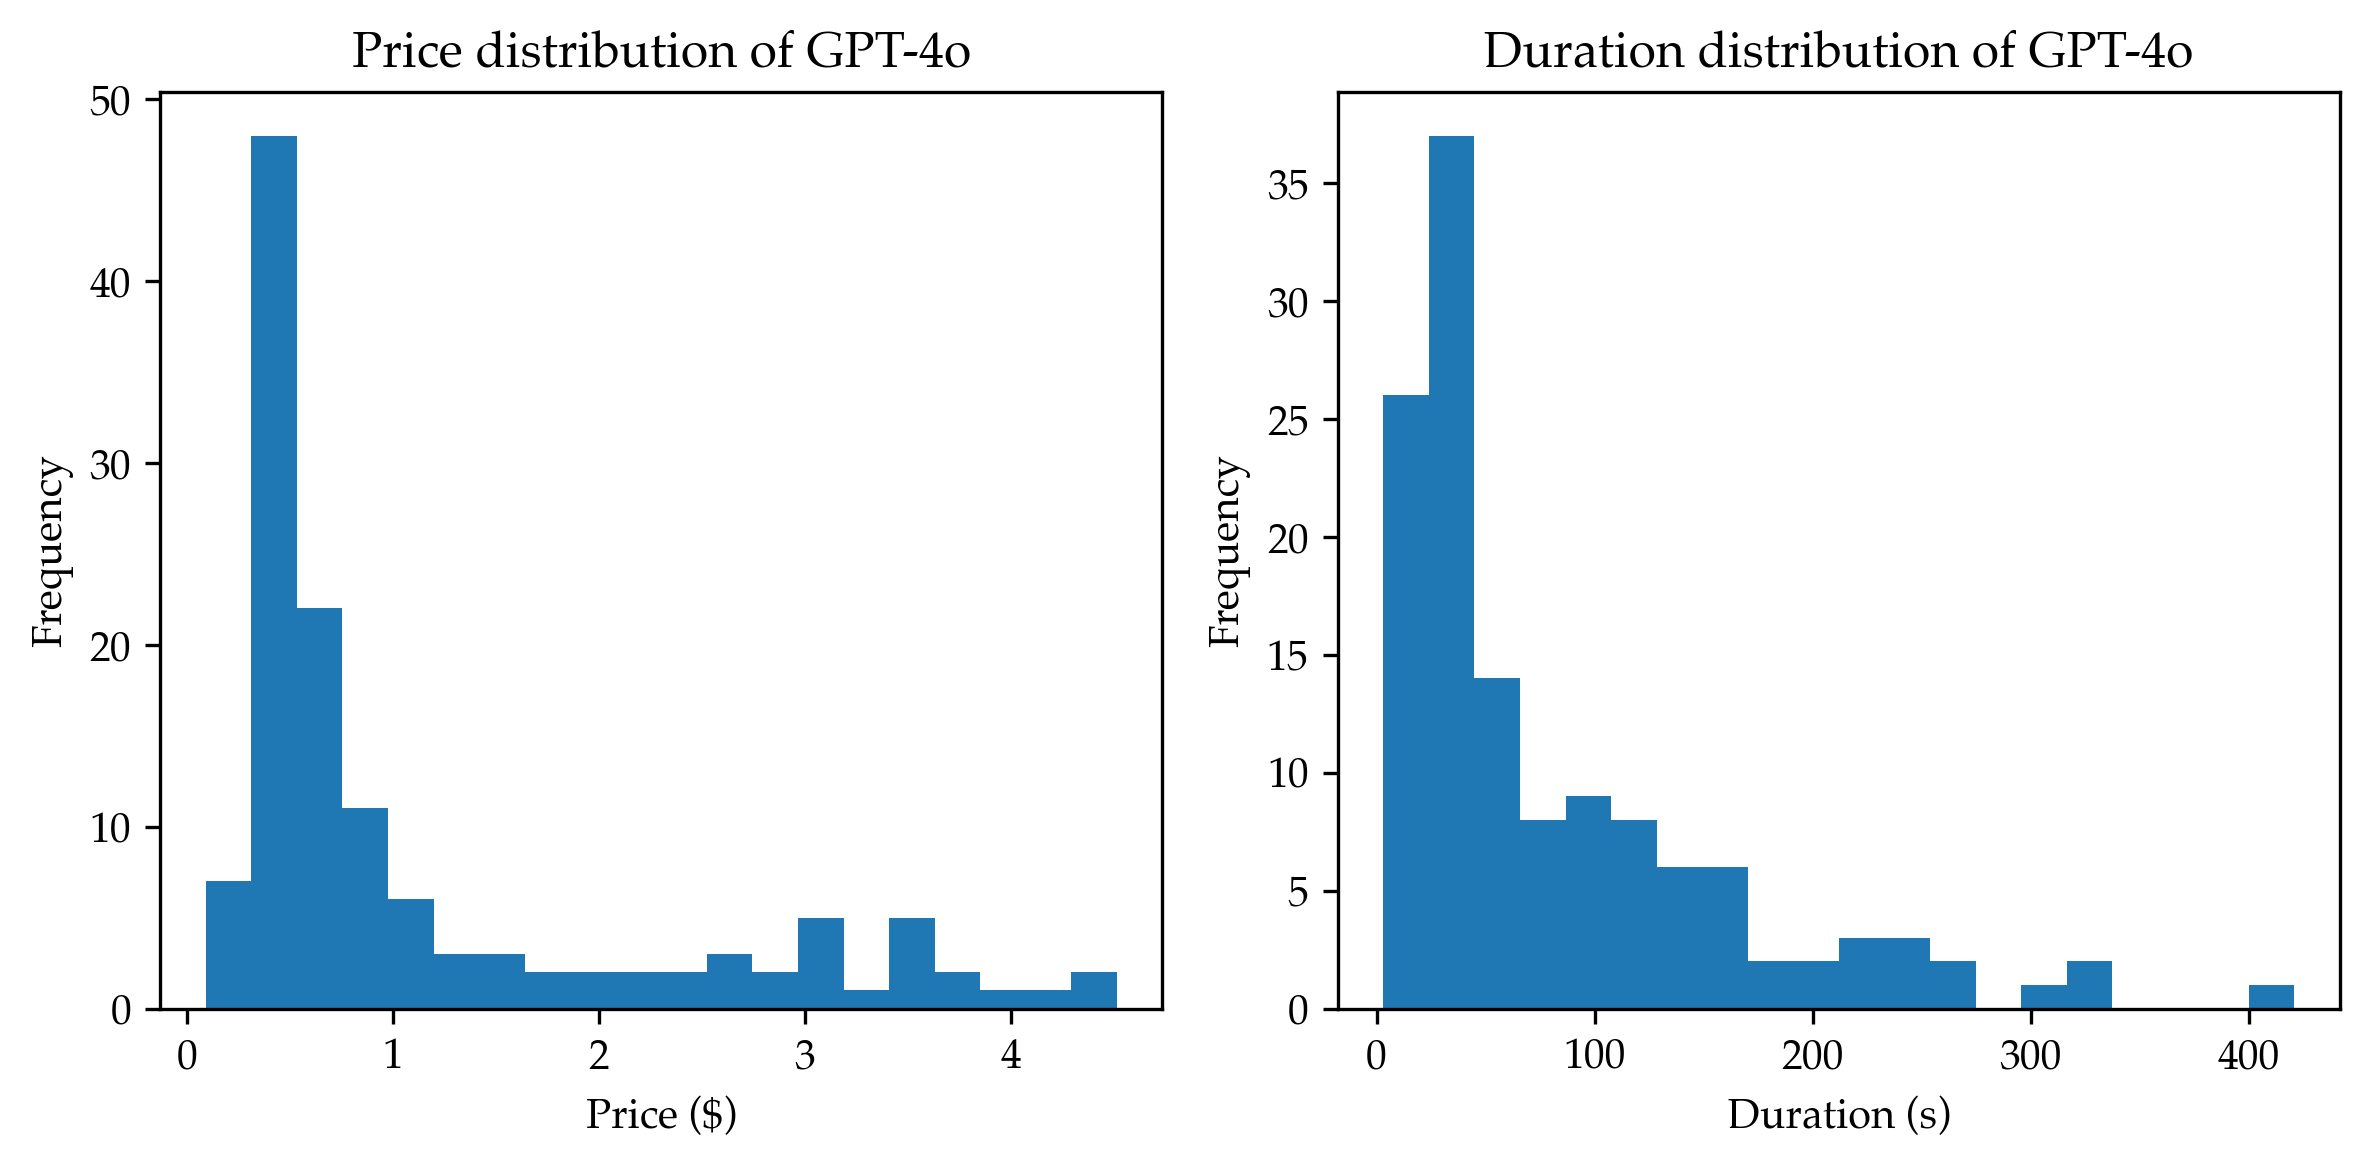
The image contains two side-by-side histograms comparing the distribution of prices and durations for GPT-4o interactions. Both histograms use blue bars to represent frequency counts, with the x-axis showing monetary value (price) and time (duration), and the y-axis showing frequency.
### Components/Axes
**Left Chart (Price Distribution):**
- **Title:** "Price distribution of GPT-4o"
- **X-axis:** "Price ($)" with bins at 0, 0.5, 1, 1.5, 2, 2.5, 3, 3.5, 4
- **Y-axis:** "Frequency" (0–50)
- **Legend:** None (single blue color for all bars)
**Right Chart (Duration Distribution):**
- **Title:** "Duration distribution of GPT-4o"
- **X-axis:** "Duration (s)" with bins at 0–100, 100–200, 200–300, 300–400
- **Y-axis:** "Frequency" (0–35)
- **Legend:** None (single blue color for all bars)
### Detailed Analysis
**Price Distribution:**
- **Key Data Points:**
- 0–0.5: ~48 interactions
- 0.5–1: ~22 interactions
- 1–1.5: ~11 interactions
- 1.5–2: ~3 interactions
- 2–2.5: ~2 interactions
- 2.5–3: ~1 interaction
- 3–3.5: ~1 interaction
- 3.5–4: ~1 interaction
- **Trend:** Sharp decline in frequency as price increases. Over 90% of interactions occur below $1.
**Duration Distribution:**
- **Key Data Points:**
- 0–100s: ~37 interactions
- 100–200s: ~14 interactions
- 200–300s: ~6 interactions
- 300–400s: ~2 interactions
- **Trend:** Exponential decay in frequency with increasing duration. 80% of interactions last under 100 seconds.
### Key Observations
1. **Price Concentration:** 95% of interactions cost less than $1.50, with a single outlier at $4.
2. **Duration Concentration:** 85% of interactions last under 100 seconds, with a long tail extending to 400s.
3. **Skewness:** Both distributions are right-skewed, indicating rare high-value/long-duration interactions.
### Interpretation
The data suggests GPT-4o is primarily used for low-cost, short-duration tasks, with a small fraction of interactions involving higher costs or longer durations. This could reflect:
- **Typical Use Cases:** Quick queries, basic content generation
- **Outliers:** Complex tasks (e.g., code generation, long-form writing) driving the tail
- **Economic Efficiency:** Most users prioritize cost-effective, rapid interactions
The stark contrast between price and duration distributions implies that while most interactions are brief and inexpensive, a minority of users engage in resource-intensive activities that drive up both metrics.