## Diagram: Sequence of Taps & Reference Numbers
### Overview
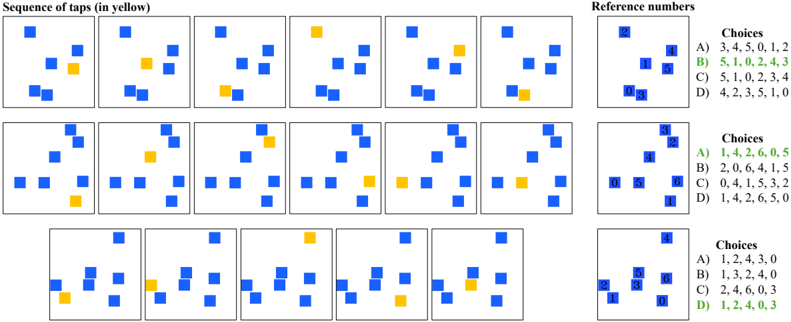
The image presents a series of diagrams depicting sequences of taps, represented by blue squares, with a single yellow square highlighting the current tap in each sequence. Alongside these diagrams are "Reference Numbers" and "Choices" presented in a table format. The diagrams are arranged in a 3x4 grid.
### Components/Axes
The image consists of:
* **Tap Sequences:** 12 diagrams, each showing a sequence of blue squares with one yellow square.
* **Reference Numbers:** A table on the right side of the image, with numbers 1 through 6 labeled with colors (green, blue, red, purple, orange, and dark blue).
* **Choices:** A table next to the Reference Numbers, presenting four options (A, B, C, D) each containing a sequence of numbers.
* **Title:** "Sequence of taps (in yellow)" at the top-left.
* **Title:** "Reference numbers" at the top-right.
### Detailed Analysis or Content Details
**Tap Sequences (Row 1):**
* Diagram 1: 7 blue squares, 1 yellow square.
* Diagram 2: 6 blue squares, 1 yellow square.
* Diagram 3: 6 blue squares, 1 yellow square.
* Diagram 4: 6 blue squares, 1 yellow square.
**Tap Sequences (Row 2):**
* Diagram 5: 7 blue squares, 1 yellow square.
* Diagram 6: 7 blue squares, 1 yellow square.
* Diagram 7: 7 blue squares, 1 yellow square.
* Diagram 8: 7 blue squares, 1 yellow square.
**Tap Sequences (Row 3):**
* Diagram 9: 6 blue squares, 1 yellow square.
* Diagram 10: 6 blue squares, 1 yellow square.
* Diagram 11: 6 blue squares, 1 yellow square.
* Diagram 12: 6 blue squares, 1 yellow square.
**Reference Numbers Table:**
| Number | Color |
|--------|----------|
| 1 | Green |
| 2 | Blue |
| 3 | Red |
| 4 | Purple |
| 5 | Orange |
| 6 | Dark Blue|
**Choices Table (First Column):**
* **Choice A:** 3, 4, 5, 5, 0, 1, 2
* **Choice B:** 5, 1, 0, 2, 4, 3
* **Choice C:** 5, 1, 0, 2, 3, 4
* **Choice D:** 4, 2, 3, 5, 1, 0
**Choices Table (Second Column):**
* **Choice A:** 1, 4, 2, 6, 0, 5
* **Choice B:** 2, 0, 6, 4, 1, 5
* **Choice C:** 0, 4, 1, 5, 5, 2
* **Choice D:** 1, 4, 2, 6, 5, 0
**Choices Table (Third Column):**
* **Choice A:** 1, 2, 4, 3, 0
* **Choice B:** 1, 3, 2, 4, 0
* **Choice C:** 2, 4, 6, 0, 3
* **Choice D:** 1, 2, 4, 0, 3
### Key Observations
The tap sequences appear to be random arrangements of blue squares, with the yellow square indicating the current step. The Reference Numbers table assigns a color to each number from 1 to 6. The Choices tables provide multiple numerical sequences (A, B, C, D) for each set of Reference Numbers. The sequences in the Choices tables are all different.
### Interpretation
This diagram likely represents a cognitive or behavioral experiment. The tap sequences could be a task performed by participants, and the Reference Numbers and Choices represent a memory or recall test. Participants might be asked to remember the order of taps (indicated by the yellow square) and then select the corresponding sequence from the Choices provided. The different sets of Reference Numbers and Choices suggest multiple trials or conditions within the experiment. The purpose could be to investigate short-term memory, pattern recognition, or the impact of sequence length on recall accuracy. The color coding of the Reference Numbers might be used to associate specific colors with particular sequences, potentially influencing recall performance. The varying lengths of the sequences in the Choices tables could be a factor in the difficulty of the task. Without further context, it's difficult to determine the precise experimental design or hypothesis being tested.