## Bar Chart: Performance Metrics vs. Number of Steps
### Overview
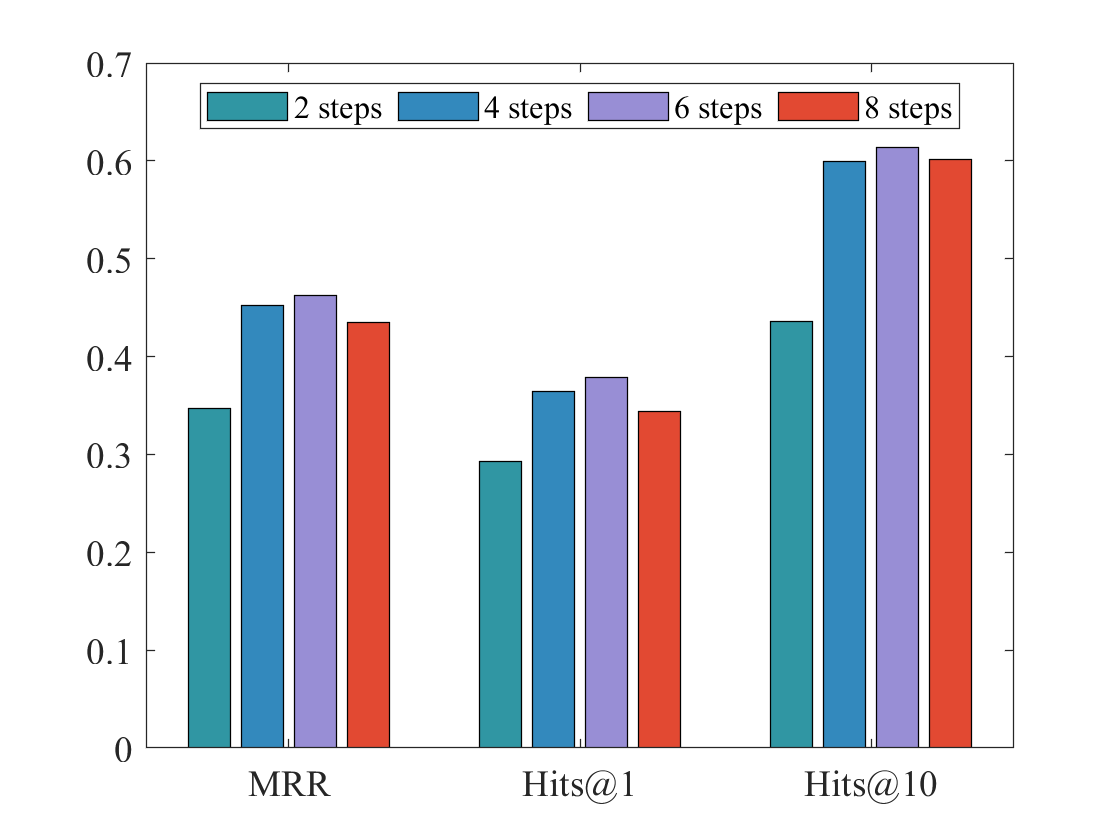
The image is a bar chart comparing the performance of a model across three metrics (MRR, Hits@1, Hits@10) using different numbers of steps (2, 4, 6, and 8). The y-axis represents the value of the metric, ranging from 0 to 0.7. The x-axis represents the metric type. Each metric has four bars representing the different step values.
### Components/Axes
* **X-axis:** Categorical axis with three categories: "MRR", "Hits@1", and "Hits@10".
* **Y-axis:** Numerical axis ranging from 0 to 0.7, with increments of 0.1.
* **Legend:** Located at the top-left of the chart.
* Teal: "2 steps"
* Blue: "4 steps"
* Lavender: "6 steps"
* Red: "8 steps"
### Detailed Analysis
**MRR (Mean Reciprocal Rank)**
* **2 steps (Teal):** Approximately 0.35
* **4 steps (Blue):** Approximately 0.45
* **6 steps (Lavender):** Approximately 0.47
* **8 steps (Red):** Approximately 0.44
**Trend:** The MRR generally increases from 2 steps to 6 steps, then slightly decreases at 8 steps.
**Hits@1**
* **2 steps (Teal):** Approximately 0.30
* **4 steps (Blue):** Approximately 0.37
* **6 steps (Lavender):** Approximately 0.38
* **8 steps (Red):** Approximately 0.35
**Trend:** The Hits@1 increases from 2 steps to 6 steps, then decreases at 8 steps.
**Hits@10**
* **2 steps (Teal):** Approximately 0.44
* **4 steps (Blue):** Approximately 0.60
* **6 steps (Lavender):** Approximately 0.61
* **8 steps (Red):** Approximately 0.60
**Trend:** The Hits@10 increases significantly from 2 steps to 4 steps, then plateaus between 4 and 8 steps.
### Key Observations
* For all metrics, performance generally increases as the number of steps increases from 2 to 6.
* The performance at 8 steps is sometimes slightly lower than at 6 steps.
* Hits@10 shows the most significant improvement with increasing steps, especially between 2 and 4 steps.
### Interpretation
The chart suggests that increasing the number of steps generally improves the model's performance, but there might be a point of diminishing returns or even a slight decrease in performance beyond 6 steps. The Hits@10 metric appears to be the most sensitive to the number of steps, indicating that increasing steps significantly improves the model's ability to find relevant results within the top 10. The model performs best with 6 steps across all metrics.