\n
## Bar Chart: Performance Comparison by Step Count
### Overview
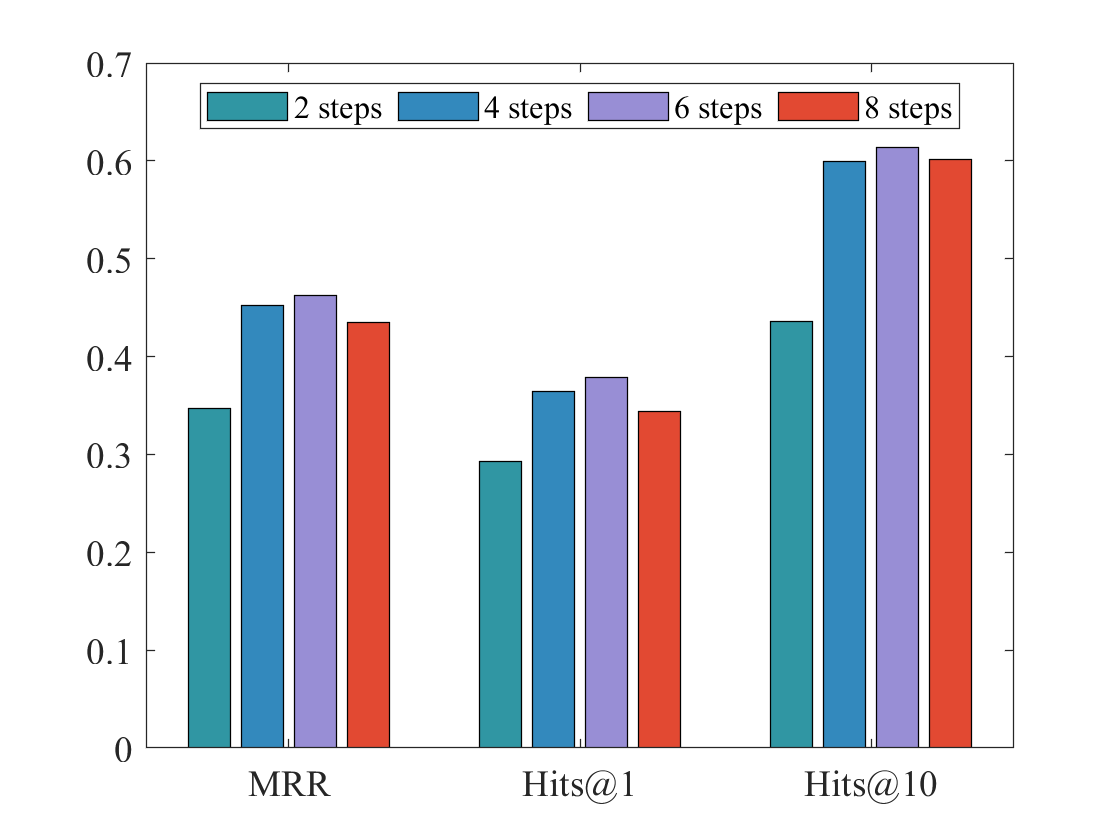
This bar chart compares the performance of a system across three metrics (MRR, Hits@1, Hits@10) using four different step counts (2, 4, 6, and 8). The performance is represented by a numerical value ranging from 0 to 0.7 on the y-axis.
### Components/Axes
* **X-axis:** Represents the evaluation metrics: "MRR", "Hits@1", and "Hits@10".
* **Y-axis:** Represents the performance score, ranging from 0.0 to 0.7, with increments of 0.1.
* **Legend:** Located at the top-center of the chart, identifies the different step counts with corresponding colors:
* 2 steps (Light Blue)
* 4 steps (Medium Blue)
* 6 steps (Light Purple)
* 8 steps (Red)
### Detailed Analysis
The chart consists of three groups of bars, one for each metric. Within each group, there are four bars representing the performance at each step count.
**MRR (Mean Reciprocal Rank):**
* 2 steps: Approximately 0.35
* 4 steps: Approximately 0.46
* 6 steps: Approximately 0.47
* 8 steps: Approximately 0.42
*Trend:* The MRR score increases from 2 to 6 steps, then slightly decreases at 8 steps.
**Hits@1 (Hit Rate at Rank 1):**
* 2 steps: Approximately 0.30
* 4 steps: Approximately 0.37
* 6 steps: Approximately 0.39
* 8 steps: Approximately 0.34
*Trend:* The Hits@1 score increases from 2 to 6 steps, then decreases at 8 steps.
**Hits@10 (Hit Rate at Rank 10):**
* 2 steps: Approximately 0.45
* 4 steps: Approximately 0.58
* 6 steps: Approximately 0.61
* 8 steps: Approximately 0.62
*Trend:* The Hits@10 score consistently increases with the number of steps, reaching its highest value at 8 steps.
### Key Observations
* The Hits@10 metric shows the most significant and consistent improvement with increasing step counts.
* Both MRR and Hits@1 metrics show improvement up to 6 steps, but performance plateaus or slightly decreases at 8 steps.
* The performance difference between 2 steps and 8 steps is most pronounced for Hits@10.
### Interpretation
The data suggests that increasing the number of steps generally improves the system's performance, particularly in terms of finding relevant results within the top 10 (Hits@10). However, there appears to be a diminishing return or even a slight degradation in performance for MRR and Hits@1 when exceeding 6 steps. This could indicate that beyond a certain point, additional steps introduce noise or complexity that negatively impacts the system's ability to rank the most relevant results highly. The optimal step count appears to be around 6 for maximizing both precision (Hits@1) and overall ranking quality (MRR), while 8 steps provide the best recall (Hits@10). Further investigation might be needed to understand why performance plateaus or decreases at higher step counts.