## Grouped Bar Chart: Performance Metrics by Step Count
### Overview
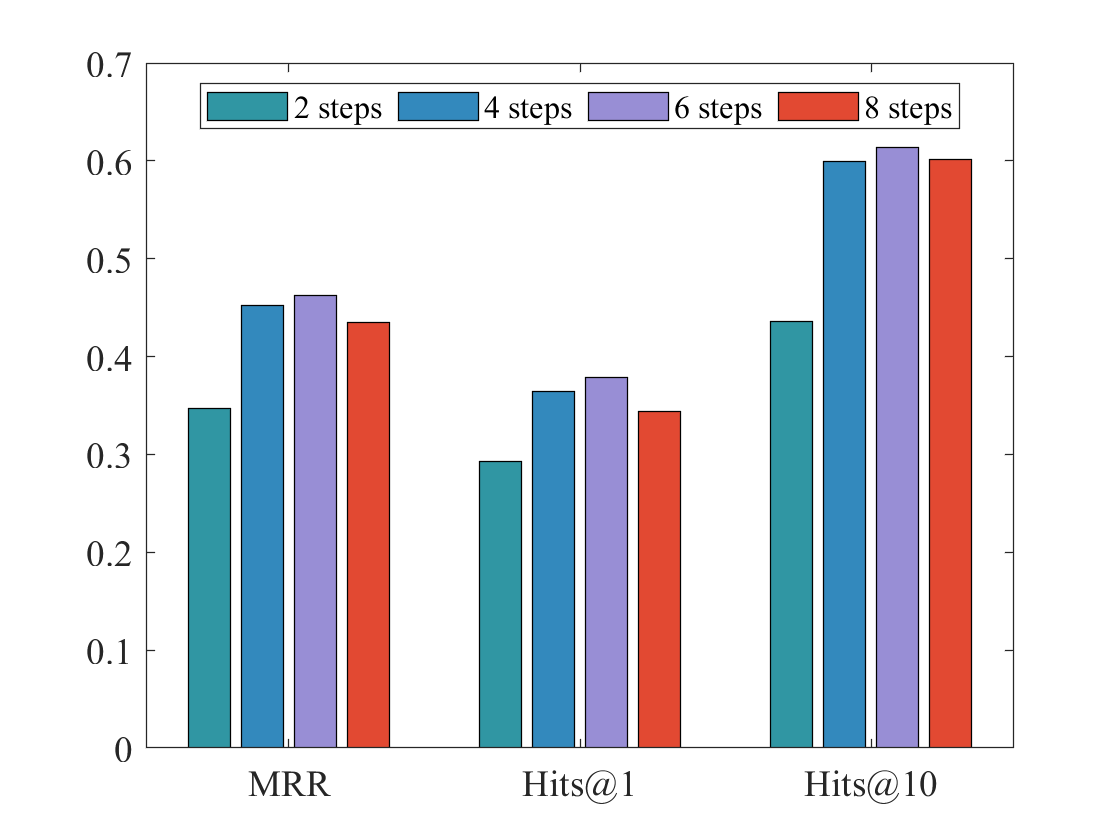
The image displays a grouped bar chart comparing three performance metrics (MRR, Hits@1, Hits@10) across four different step counts (2, 4, 6, and 8 steps). The chart illustrates how these metrics change as the number of steps increases.
### Components/Axes
* **Chart Type:** Grouped Bar Chart.
* **X-Axis (Categories):** Three distinct metric categories are labeled at the bottom:
* `MRR` (Mean Reciprocal Rank)
* `Hits@1`
* `Hits@10`
* **Y-Axis (Scale):** A numerical scale on the left side, ranging from `0` to `0.7` in increments of `0.1`. There is no explicit axis title.
* **Legend:** Positioned at the top-center of the chart area, enclosed in a box. It defines four data series by color:
* Teal bar: `2 steps`
* Blue bar: `4 steps`
* Purple bar: `6 steps`
* Red bar: `8 steps`
### Detailed Analysis
The chart presents the following approximate values for each metric and step count. Values are estimated based on bar height relative to the y-axis grid.
**1. MRR (Left Group):**
* **Trend:** Performance increases from 2 to 6 steps, then slightly decreases at 8 steps.
* **Data Points:**
* 2 steps (Teal): ~0.35
* 4 steps (Blue): ~0.45
* 6 steps (Purple): ~0.46 (Highest in this group)
* 8 steps (Red): ~0.43
**2. Hits@1 (Center Group):**
* **Trend:** Similar pattern to MRR, with a peak at 6 steps.
* **Data Points:**
* 2 steps (Teal): ~0.29
* 4 steps (Blue): ~0.36
* 6 steps (Purple): ~0.38 (Highest in this group)
* 8 steps (Red): ~0.34
**3. Hits@10 (Right Group):**
* **Trend:** Shows the highest overall values. Performance increases sharply from 2 to 4 steps, peaks at 6 steps, and remains very high at 8 steps.
* **Data Points:**
* 2 steps (Teal): ~0.44
* 4 steps (Blue): ~0.60
* 6 steps (Purple): ~0.61 (Highest in the entire chart)
* 8 steps (Red): ~0.60
### Key Observations
1. **Consistent Peak at 6 Steps:** For all three metrics (MRR, Hits@1, Hits@10), the 6-step configuration (purple bar) yields the highest performance.
2. **Diminishing Returns/Decline at 8 Steps:** After the peak at 6 steps, performance for MRR and Hits@1 decreases when moving to 8 steps. Hits@10 performance plateaus, showing only a negligible decrease from 6 to 8 steps.
3. **Metric Hierarchy:** The `Hits@10` metric consistently shows the highest values across all step counts, followed by `MRR`, and then `Hits@1`. This is expected, as Hits@10 is a less strict metric than Hits@1.
4. **Lowest Baseline:** The 2-step configuration (teal bar) is the worst performer for every metric.
### Interpretation
This chart likely evaluates the performance of a multi-step reasoning or retrieval system (e.g., in knowledge graph completion or question answering). The data suggests a clear relationship between the number of reasoning steps and model performance:
* **Optimal Complexity:** There is a "sweet spot" at **6 steps**, where the system achieves its best results across all measured metrics. This indicates that increasing computational steps improves performance up to a point.
* **Over-complexity Penalty:** Pushing beyond the optimal point to **8 steps** does not yield further benefits and may even be detrimental for stricter metrics (MRR, Hits@1). This could be due to error propagation in longer reasoning chains, increased difficulty in optimization, or the model beginning to overfit to the step-generation process.
* **Practical Implication:** The findings argue for careful tuning of the step count parameter. Simply maximizing steps is not an effective strategy; the system's performance is sensitive to this hyperparameter, with 6 steps being the most effective in this specific evaluation. The near-parity between 6 and 8 steps for Hits@10 suggests that for a more lenient evaluation, the cost of additional computation (8 steps) may not be justified.