## Bar Chart: Performance Metrics Across Step Counts
### Overview
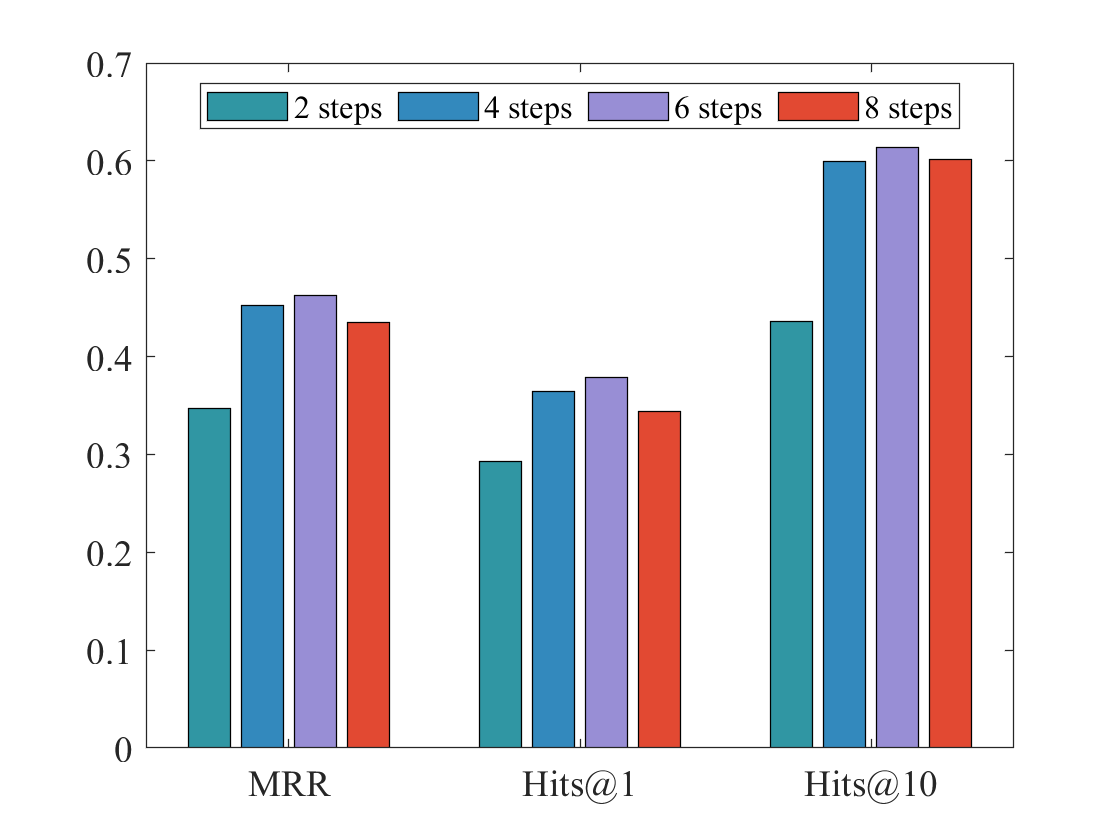
The chart compares performance metrics (MRR, Hits@1, Hits@10) across four step counts (2, 4, 6, 8 steps) using grouped bars. Each metric is measured on a scale from 0 to 0.7, with distinct colors for each step count.
### Components/Axes
- **X-axis**: Three categories:
- MRR (Mean Reciprocal Rank)
- Hits@1
- Hits@10
- **Y-axis**: Numerical scale from 0 to 0.7, labeled in increments of 0.1.
- **Legend**: Located at the top-right, mapping colors to step counts:
- Teal: 2 steps
- Blue: 4 steps
- Purple: 6 steps
- Red: 8 steps
### Detailed Analysis
1. **MRR**:
- 2 steps: ~0.35
- 4 steps: ~0.45
- 6 steps: ~0.47
- 8 steps: ~0.43
- *Trend*: Peaks at 6 steps, then declines slightly at 8 steps.
2. **Hits@1**:
- 2 steps: ~0.30
- 4 steps: ~0.37
- 6 steps: ~0.39
- 8 steps: ~0.35
- *Trend*: Gradual increase until 6 steps, then a drop at 8 steps.
3. **Hits@10**:
- 2 steps: ~0.44
- 4 steps: ~0.60
- 6 steps: ~0.62
- 8 steps: ~0.60
- *Trend*: Sharp rise from 2 to 4 steps, plateauing at 6 and 8 steps.
### Key Observations
- **Highest Performance**: Hits@10 consistently shows the highest values across all step counts.
- **Diminishing Returns**: MRR and Hits@1 exhibit declines at 8 steps compared to 6 steps.
- **Step Count Impact**: Increasing steps generally improves performance, but beyond 6 steps, gains are minimal or reversed.
### Interpretation
The data suggests that increasing the number of steps improves performance metrics up to a point (6 steps), after which further steps yield diminishing or negative returns. Hits@10 benefits most from additional steps, indicating it may be more sensitive to incremental improvements. The decline in MRR and Hits@1 at 8 steps implies potential overfitting or inefficiencies in extended processing. This pattern could inform optimization strategies, such as capping step counts at 6 for these metrics.