## Bubble Chart: GLUE Score vs. Date and GFLOPS
### Overview
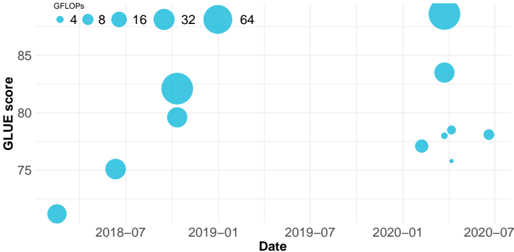
The image is a bubble chart showing the relationship between GLUE score, date, and GFLOPS. The x-axis represents the date, the y-axis represents the GLUE score, and the size of the bubbles represents the GFLOPS. The chart displays data points from 2018-07 to 2020-07.
### Components/Axes
* **X-axis:** Date, with markers at 2018-07, 2019-01, 2019-07, 2020-01, and 2020-07.
* **Y-axis:** GLUE score, ranging from approximately 71 to 87, with markers at 75, 80, and 85.
* **Bubble Size:** Represents GFLOPS, with a legend at the top indicating the size of the bubbles for 4, 8, 16, 32, and 64 GFLOPS. The bubbles are all the same color, a light blue.
### Detailed Analysis
* **2018-07:** One data point with a GLUE score of approximately 72 and a GFLOPS of 4.
* **2018-07:** One data point with a GLUE score of approximately 75 and a GFLOPS of 8.
* **2019-01:** Two data points. One with a GLUE score of approximately 79 and a GFLOPS of 32. The other with a GLUE score of approximately 82 and a GFLOPS of 32.
* **2020-01:** Multiple data points. One with a GLUE score of approximately 77 and a GFLOPS of 16. One with a GLUE score of approximately 77 and a GFLOPS of 8. One with a GLUE score of approximately 76 and a GFLOPS of 8. One with a GLUE score of approximately 83 and a GFLOPS of 32. One with a GLUE score of approximately 87 and a GFLOPS of 64.
* **2020-07:** Two data points. One with a GLUE score of approximately 78 and a GFLOPS of 8. One with a GLUE score of approximately 78 and a GFLOPS of 16.
### Key Observations
* The GLUE score generally increases with GFLOPS.
* The GLUE score generally increases over time.
* There is a cluster of data points in 2020-01, indicating a period of significant experimentation or data collection.
### Interpretation
The bubble chart suggests a positive correlation between GFLOPS and GLUE score, indicating that higher computational power generally leads to better performance on the GLUE benchmark. The trend over time also suggests improvements in GLUE scores, potentially due to advancements in models, training techniques, or hardware. The cluster of data points in 2020-01 could indicate a period of rapid development or experimentation, where different configurations were tested to optimize performance. The data shows that the highest GLUE score was achieved in 2020-01 with 64 GFLOPS.