\n
## Bubble Chart: GLUE Score vs. Date (Model Computational Cost)
### Overview
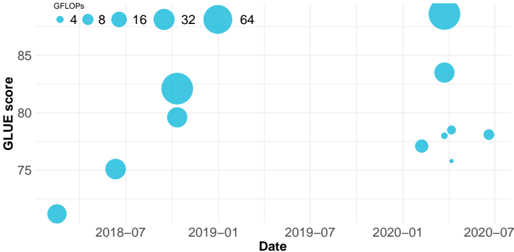
The image is a bubble chart plotting the performance of various natural language processing (NLP) models over time. The chart visualizes three dimensions of data: the date of the model's introduction or publication (x-axis), its performance on the GLUE benchmark (y-axis), and its computational cost in GFLOPs (bubble size).
### Components/Axes
* **Chart Type:** Bubble Chart / Scatter Plot with variable point size.
* **X-Axis:**
* **Label:** `Date`
* **Scale:** Time, from approximately mid-2018 to mid-2020.
* **Major Tick Marks:** `2018-07`, `2019-01`, `2019-07`, `2020-01`, `2020-07`.
* **Y-Axis:**
* **Label:** `GLUE score`
* **Scale:** Numerical, ranging from below 75 to above 85.
* **Major Tick Marks:** `75`, `80`, `85`.
* **Legend (Size Encoding):**
* **Location:** Top-left corner of the chart area.
* **Label:** `GFLOPs`
* **Scale:** Bubble diameter corresponds to computational cost. The legend shows six reference sizes:
* Smallest dot: `4`
* Next size: `8`
* Next size: `16`
* Next size: `32`
* Largest shown in legend: `64`
* Note: The largest bubble on the chart (early 2020) is significantly larger than the `64` GFLOPs reference bubble, suggesting a value much greater than 64.
### Detailed Analysis
**Data Points (Approximate Values, ordered chronologically):**
1. **~2018-05:** A small bubble (≈4-8 GFLOPs) at a GLUE score of ≈72.
2. **~2018-07:** A medium-small bubble (≈8-16 GFLOPs) at a GLUE score of ≈75.
3. **~2018-10:** A large bubble (≈32-64 GFLOPs) at a GLUE score of ≈82.
4. **~2018-11:** A medium-large bubble (≈16-32 GFLOPs) at a GLUE score of ≈80.
5. **~2020-01:** A very large bubble (>>64 GFLOPs) at a GLUE score of ≈87. This is the highest-performing and largest model shown.
6. **~2020-02:** A large bubble (≈32-64 GFLOPs) at a GLUE score of ≈84.
7. **~2020-03:** A cluster of three small-to-medium bubbles (≈4-16 GFLOPs) at GLUE scores between ≈76 and ≈78.
8. **~2020-06:** A medium bubble (≈8-16 GFLOPs) at a GLUE score of ≈78.
**Trend Verification:**
* **Overall Trend:** There is a general upward trend in GLUE scores from 2018 to 2020, indicating rapid progress in NLP model performance.
* **Cost-Performance Relationship:** Larger bubbles (higher GFLOPs) are generally positioned higher on the y-axis (higher GLUE score), suggesting a correlation between computational cost and benchmark performance. However, there are exceptions, such as the cluster of smaller, lower-scoring models in early 2020.
### Key Observations
1. **Performance Leap:** A dramatic increase in both GLUE score and model size (GFLOPs) occurs around the start of 2020, represented by the largest bubble on the chart.
2. **Model Diversity in 2020:** Early 2020 shows a high density of models with varying sizes and performance levels, indicating a period of intense research activity and experimentation.
3. **Outlier:** The cluster of three small bubbles in early 2020 (points 7) represents models that are computationally cheaper but achieve lower GLUE scores compared to the contemporaneous large models.
4. **Plateau/Regression:** The final data point in mid-2020 shows a moderate-sized model with a score (~78) lower than the peak achieved earlier that year.
### Interpretation
This chart visually narrates a key period in the evolution of large language models (LLMs). The data suggests that significant breakthroughs in benchmark performance (GLUE) were closely tied to massive increases in model scale and computational requirements (GFLOPs), particularly evident with the outlier model in early 2020. This aligns with the "scaling laws" hypothesis in AI research.
The cluster of smaller models in 2020 indicates parallel research into more efficient architectures or distillation techniques, aiming to achieve respectable performance without the extreme computational cost. The final data point may represent such an efficient model or could indicate that simply scaling existing architectures began to yield diminishing returns on this specific benchmark by mid-2020.
The chart effectively demonstrates the trade-off between performance and resource consumption, highlighting the field's shift towards increasingly large and powerful models during this timeframe. The absence of data points between late 2018 and early 2020 might represent a period of development leading to the major leap seen in 2020.