## Scatter Plot: GLUE Score vs. Date with GFLOPs Size Encoding
### Overview
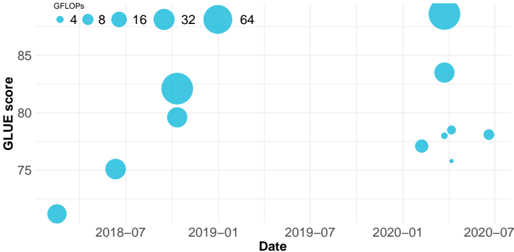
The image is a scatter plot visualizing the relationship between **GLUE scores** (y-axis) and **dates** (x-axis), with bubble sizes encoding **GFLOPs** values. The plot spans from July 2018 to July 2020, showing temporal trends in performance metrics.
---
### Components/Axes
- **X-axis (Date)**: Labeled "Date," with markers at:
- 2018-07
- 2019-01
- 2019-07
- 2020-01
- 2020-07
- **Y-axis (GLUE Score)**: Labeled "GLUE score," ranging from 70 to 90 in increments of 5.
- **Legend**: Located in the **top-left corner**, titled "GFLOPs," with five size categories:
- 4 (smallest bubble)
- 8
- 16
- 32
- 64 (largest bubble)
- **Bubble Colors**: All bubbles are cyan (#00BFFF), with size proportional to GFLOPs values.
---
### Detailed Analysis
1. **Data Points**:
- **2018-07**: A single bubble at ~70 GLUE score, GFLOPs = 4.
- **2019-01**: Two bubbles:
- GFLOPs = 16, GLUE score ~80.
- GFLOPs = 32, GLUE score ~82.
- **2019-07**: One bubble at ~85 GLUE score, GFLOPs = 64.
- **2020-01**: Four bubbles:
- GFLOPs = 4, GLUE score ~75.
- GFLOPs = 8, GLUE score ~78.
- GFLOPs = 16, GLUE score ~79.
- GFLOPs = 32, GLUE score ~83.
- **2020-07**: One bubble at ~77 GLUE score, GFLOPs = 8.
2. **Trends**:
- **Upward Correlation**: Higher GFLOPs generally correspond to higher GLUE scores (e.g., 64 GFLOPs → 85 score vs. 4 GFLOPs → 70 score).
- **Temporal Progression**: Scores improve steadily until 2019-07 (peak at 85), then fluctuate in 2020 with lower GFLOPs but mixed results.
- **Anomaly**: The 2020-01 cluster shows high scores (75–83) despite lower GFLOPs (4–32), suggesting efficiency gains or other optimizations.
---
### Key Observations
- **GFLOPs-Score Relationship**: Larger bubbles (higher GFLOPs) dominate higher score regions, but exceptions exist (e.g., 2020-01).
- **Temporal Decline in GFLOPs**: After 2019-07, GFLOPs drop to 8–32 by 2020-07, yet scores remain above 75.
- **Outlier**: The 2020-07 bubble (GFLOPs = 8, score = 77) deviates from the trend, indicating potential inefficiency or external factors.
---
### Interpretation
The data suggests that **computational power (GFLOPs)** strongly influences GLUE scores initially, but post-2019, **efficiency improvements** (e.g., algorithmic optimizations) may sustain performance despite reduced hardware power. The 2020-01 cluster highlights a decoupling of raw compute from performance, implying advancements in model architecture or training techniques. The 2020-07 outlier raises questions about whether efficiency gains plateaued or were offset by other constraints (e.g., data quality, model complexity).