TECHNICAL ASSET FINGERPRINT
cbcd2fd730e39c9993f98999
Click to view fullscreen
Press ESC or click to close
FOUND IN PAPERS
EXPERT: healer-alpha-free VERSION 1
RUNTIME: free/openrouter/healer-alpha
INTEL_VERIFIED
\n
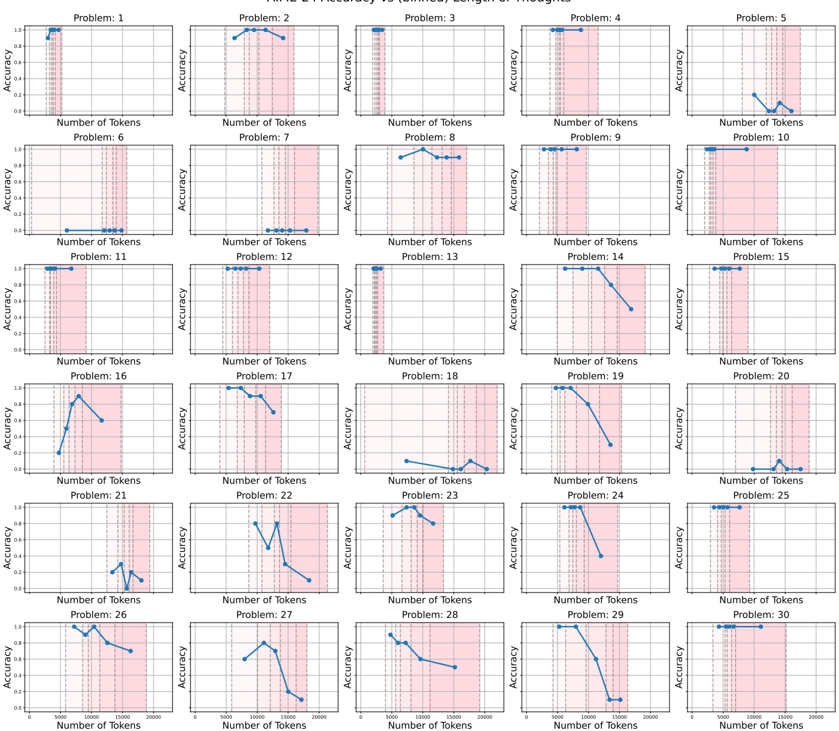
## Line Chart Grid: Accuracy vs. Number of Tokens for 30 Problems
### Overview
The image displays a grid of 30 individual line charts arranged in 6 rows and 5 columns. Each chart plots "Accuracy" against the "Number of Tokens" for a specific problem, labeled sequentially from "Problem: 1" to "Problem: 30". The charts collectively analyze how model performance (accuracy) changes as the input length (number of tokens) increases for different tasks. A consistent pink shaded region appears in the right portion of each chart's plot area.
### Components/Axes
* **Chart Titles:** Each subplot is titled "Problem: [N]", where N is an integer from 1 to 30.
* **Y-Axis:** Labeled "Accuracy" on the left side of each chart. The scale is consistent across all charts, ranging from 0.0 to 1.0, with major tick marks at 0.0, 0.2, 0.4, 0.6, 0.8, and 1.0.
* **X-Axis:** Labeled "Number of Tokens" at the bottom of each chart. The scale is consistent, ranging from 0 to 2000, with major tick marks at 0, 500, 1000, 1500, and 2000.
* **Data Series:** A single blue line with circular markers plots the accuracy for each problem at various token counts.
* **Shaded Region:** A vertical pink shaded band is present in the right portion of each chart's plot area. Its left edge aligns approximately with the 1000-token mark on the x-axis, and it extends to the right edge (2000 tokens). This likely highlights a specific range of interest, such as longer input lengths.
### Detailed Analysis
The following describes the trend and approximate data points for each problem's blue line. Values are estimated from the visual plot.
* **Problem 1:** Accuracy starts at ~1.0 for low tokens and remains high, ending near 1.0 at ~1000 tokens.
* **Problem 2:** Accuracy starts high (~0.95), peaks near 1.0 around 1000 tokens, then slightly declines to ~0.9 by 2000 tokens.
* **Problem 3:** Accuracy is consistently high (~1.0) across the visible token range (up to ~1000 tokens).
* **Problem 4:** Accuracy is consistently high (~1.0) across the visible token range (up to ~1000 tokens).
* **Problem 5:** Accuracy starts low (~0.1), rises to a peak of ~0.3 around 1500 tokens, then falls back to ~0.1 by 2000 tokens.
* **Problem 6:** Accuracy is consistently at or near 0.0 across the entire token range.
* **Problem 7:** Accuracy is consistently at or near 0.0 across the entire token range.
* **Problem 8:** Accuracy starts high (~0.95), peaks near 1.0 around 1000 tokens, then slightly declines to ~0.9 by 2000 tokens.
* **Problem 9:** Accuracy is consistently high (~1.0) across the visible token range (up to ~1000 tokens).
* **Problem 10:** Accuracy is consistently high (~1.0) across the entire token range up to 2000.
* **Problem 11:** Accuracy is consistently high (~1.0) across the visible token range (up to ~1000 tokens).
* **Problem 12:** Accuracy is consistently high (~1.0) across the visible token range (up to ~1000 tokens).
* **Problem 13:** Accuracy is consistently high (~1.0) across the visible token range (up to ~1000 tokens).
* **Problem 14:** Accuracy starts high (~1.0), then declines sharply after ~1000 tokens, falling to ~0.6 by 2000 tokens.
* **Problem 15:** Accuracy is consistently high (~1.0) across the entire token range up to 2000.
* **Problem 16:** Accuracy starts low (~0.2), rises sharply to a peak of ~0.9 around 1000 tokens, then declines to ~0.7 by 1500 tokens.
* **Problem 17:** Accuracy starts high (~1.0), then declines steadily after ~1000 tokens, falling to ~0.7 by 2000 tokens.
* **Problem 18:** Accuracy is low overall, fluctuating between ~0.0 and ~0.2 across the token range.
* **Problem 19:** Accuracy starts high (~1.0), then declines sharply after ~1000 tokens, falling to ~0.2 by 2000 tokens.
* **Problem 20:** Accuracy is low overall, fluctuating between ~0.0 and ~0.2 across the token range.
* **Problem 21:** Accuracy is low overall, fluctuating between ~0.0 and ~0.3, with a small peak around 1500 tokens.
* **Problem 22:** Accuracy starts around ~0.6, peaks near ~0.9 around 1000 tokens, then declines sharply to ~0.1 by 2000 tokens.
* **Problem 23:** Accuracy starts high (~0.95), peaks near 1.0 around 1000 tokens, then declines to ~0.7 by 1500 tokens.
* **Problem 24:** Accuracy starts high (~1.0), then declines sharply after ~1000 tokens, falling to ~0.4 by 1500 tokens.
* **Problem 25:** Accuracy is consistently high (~1.0) across the entire token range up to 2000.
* **Problem 26:** Accuracy starts high (~1.0), dips slightly, then declines to ~0.7 by 2000 tokens.
* **Problem 27:** Accuracy starts around ~0.5, peaks near ~0.8 around 1000 tokens, then declines sharply to ~0.1 by 2000 tokens.
* **Problem 28:** Accuracy starts high (~0.95), then declines steadily to ~0.4 by 2000 tokens.
* **Problem 29:** Accuracy starts high (~1.0), then declines sharply after ~1000 tokens, falling to ~0.0 by 2000 tokens.
* **Problem 30:** Accuracy is consistently high (~1.0) across the entire token range up to 2000.
### Key Observations
1. **Bimodal Performance:** Problems generally fall into two categories: those with consistently high accuracy (e.g., 1, 3, 4, 9, 10, 11, 12, 13, 15, 25, 30) and those where accuracy degrades significantly with more tokens (e.g., 14, 17, 19, 22, 24, 27, 28, 29).
2. **Critical Threshold:** For many degrading problems, the performance drop begins near or after the 1000-token mark, which coincides with the start of the pink shaded region.
3. **Low-Performing Set:** A subset of problems (6, 7, 18, 20, 21) shows near-zero accuracy regardless of token count.
4. **Peak-Then-Drop Pattern:** Several problems (5, 16, 22, 23, 27) exhibit an initial increase in accuracy to a peak around 1000-1500 tokens, followed by a decline.
5. **Visual Consistency:** All charts share identical axes scales, labels, and the pink shaded region, facilitating direct comparison.
### Interpretation
This grid of charts provides a diagnostic view of a model's performance across 30 distinct tasks as a function of input length. The data suggests:
* **Task-Dependent Robustness:** The model's ability to maintain accuracy with longer inputs is highly task-specific. Some problems are solved robustly regardless of length, while others are sensitive to increased context.
* **Length Generalization Failure:** The sharp declines in accuracy for many problems beyond ~1000 tokens indicate a failure in length generalization. The model's performance is not stable when extrapolating to sequences longer than those it may have been optimized or trained on for those specific tasks.
* **The Pink Region as a Warning Zone:** The shaded region from 1000-2000 tokens visually demarcates the "danger zone" where performance degradation is most commonly observed. It serves as a visual cue for the input length range where reliability cannot be assumed.
* **Underlying Cause:** The patterns imply potential issues such as:
* **Training Data Bias:** The model may have been trained predominantly on shorter examples for the degrading tasks.
* **Architectural Limitations:** The model's attention mechanism or context window processing may struggle with very long-range dependencies required by certain problems.
* **Task Complexity:** Some problems may inherently require more precise reasoning over long contexts, which the model fails to execute.
In summary, this visualization is a powerful tool for identifying which specific tasks are vulnerable to increased input length, guiding further investigation into model limitations and informing strategies for improvement, such as targeted fine-tuning on longer examples or architectural adjustments.
DECODING INTELLIGENCE...