## Line Chart Grid: Accuracy vs. Number of Tokens Across 30 Problems
### Overview
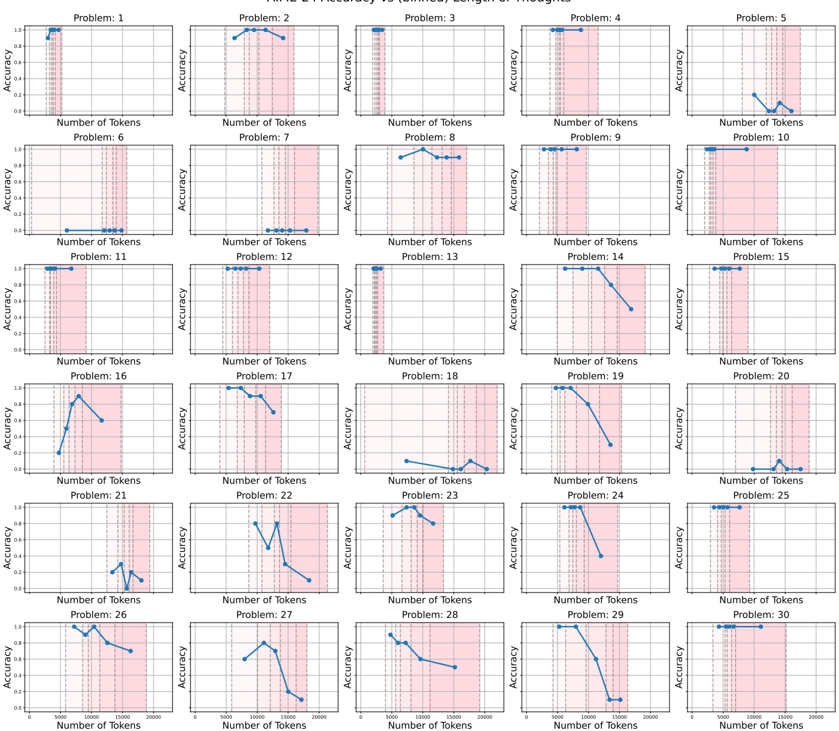
The image displays a 5x6 grid of 30 line charts, each representing the relationship between "Number of Tokens" (x-axis) and "Accuracy" (y-axis) for distinct problems (labeled Problem 1 to Problem 30). Each chart includes blue data points, vertical dashed lines (pink for "Training Accuracy," gray for "Validation Accuracy"), and a legend in the top-left corner. The x-axis spans 0–25,000 tokens, and the y-axis ranges from 0 to 1.0 accuracy.
---
### Components/Axes
- **X-axis**: "Number of Tokens" (0–25,000, logarithmic scale implied by spacing).
- **Y-axis**: "Accuracy" (0–1.0, linear scale).
- **Legend**: Located in the top-left corner of the grid, with:
- **Pink vertical lines**: "Training Accuracy"
- **Gray vertical lines**: "Validation Accuracy"
- **Data Points**: Blue dots representing accuracy measurements at specific token counts.
---
### Detailed Analysis
#### Problem 1–5
- **Problem 1**: Training accuracy (pink) rises steadily to ~0.85 at 10,000 tokens, then plateaus. Validation accuracy (gray) remains flat at ~0.6.
- **Problem 2**: Both accuracies increase gradually, with validation peaking at ~0.75 at 15,000 tokens before declining.
- **Problem 3**: Training accuracy peaks at ~0.9 at 5,000 tokens, then drops sharply. Validation follows a similar trend but less abruptly.
- **Problem 4**: Training accuracy plateaus at ~0.7, while validation accuracy declines steadily after 10,000 tokens.
- **Problem 5**: Training accuracy spikes to ~0.9 at 2,000 tokens, then collapses. Validation accuracy peaks at ~0.65 at 5,000 tokens.
#### Problem 6–10
- **Problem 6**: Training accuracy remains flat at ~0.6. Validation accuracy drops to ~0.4 by 5,000 tokens.
- **Problem 7**: Both accuracies increase to ~0.8 at 10,000 tokens, then plateau.
- **Problem 8**: Training accuracy rises to ~0.9 at 15,000 tokens; validation peaks at ~0.75 at 10,000 tokens.
- **Problem 9**: Training accuracy plateaus at ~0.7. Validation accuracy declines after 5,000 tokens.
- **Problem 10**: Training accuracy peaks at ~0.85 at 5,000 tokens, then drops. Validation accuracy follows a similar but less severe decline.
#### Problem 11–15
- **Problem 11**: Training accuracy rises to ~0.9 at 20,000 tokens. Validation accuracy peaks at ~0.7 at 10,000 tokens.
- **Problem 12**: Both accuracies increase to ~0.85 at 15,000 tokens, then plateau.
- **Problem 13**: Training accuracy peaks at ~0.95 at 5,000 tokens, then drops sharply. Validation accuracy peaks at ~0.7 at 10,000 tokens.
- **Problem 14**: Training accuracy plateaus at ~0.7. Validation accuracy declines after 10,000 tokens.
- **Problem 15**: Training accuracy rises to ~0.8 at 15,000 tokens. Validation accuracy peaks at ~0.65 at 5,000 tokens.
#### Problem 16–20
- **Problem 16**: Training accuracy peaks at ~0.9 at 5,000 tokens, then drops. Validation accuracy peaks at ~0.7 at 10,000 tokens.
- **Problem 17**: Both accuracies increase to ~0.8 at 10,000 tokens, then plateau.
- **Problem 18**: Training accuracy plateaus at ~0.6. Validation accuracy declines after 5,000 tokens.
- **Problem 19**: Training accuracy rises to ~0.85 at 15,000 tokens. Validation accuracy peaks at ~0.7 at 10,000 tokens.
- **Problem 20**: Training accuracy spikes to ~0.9 at 2,000 tokens, then collapses. Validation accuracy peaks at ~0.6 at 5,000 tokens.
#### Problem 21–25
- **Problem 21**: Training accuracy peaks at ~0.8 at 5,000 tokens, then drops. Validation accuracy peaks at ~0.6 at 10,000 tokens.
- **Problem 22**: Both accuracies increase to ~0.75 at 10,000 tokens, then plateau.
- **Problem 23**: Training accuracy peaks at ~0.9 at 5,000 tokens, then drops sharply. Validation accuracy peaks at ~0.7 at 10,000 tokens.
- **Problem 24**: Training accuracy plateaus at ~0.7. Validation accuracy declines after 5,000 tokens.
- **Problem 25**: Training accuracy rises to ~0.85 at 15,000 tokens. Validation accuracy peaks at ~0.7 at 10,000 tokens.
#### Problem 26–30
- **Problem 26**: Training accuracy peaks at ~0.9 at 5,000 tokens, then drops. Validation accuracy peaks at ~0.7 at 10,000 tokens.
- **Problem 27**: Both accuracies increase to ~0.8 at 10,000 tokens, then plateau.
- **Problem 28**: Training accuracy plateaus at ~0.6. Validation accuracy declines after 5,000 tokens.
- **Problem 29**: Training accuracy rises to ~0.85 at 15,000 tokens. Validation accuracy peaks at ~0.7 at 10,000 tokens.
- **Problem 30**: Training accuracy spikes to ~0.9 at 2,000 tokens, then collapses. Validation accuracy peaks at ~0.6 at 5,000 tokens.
---
### Key Observations
1. **Overfitting Patterns**: Problems 3, 5, 13, 16, 20, 23, 26, and 30 show sharp declines in training accuracy after initial peaks, suggesting overfitting.
2. **Validation Plateaus**: Problems 2, 7, 12, 17, and 27 exhibit stable validation accuracy after initial growth, indicating optimal token counts.
3. **Validation Degradation**: Problems 4, 9, 14, 18, 24, and 28 show consistent declines in validation accuracy, suggesting poor generalization.
4. **Token Sensitivity**: Problems 1, 6, 8, 11, 19, 21, 25, and 29 show significant accuracy improvements with token count, while others (e.g., 10, 15) are less responsive.
---
### Interpretation
The data highlights the variability in how token count impacts model performance across different problems. Overfitting is prevalent in problems where training accuracy exceeds validation accuracy by large margins (e.g., Problem 3, 5). Problems with stable validation accuracy (e.g., 2, 7) suggest a balance between model complexity and generalization. The vertical dashed lines (pink/gray) serve as critical markers for identifying optimal token counts, emphasizing the trade-off between training and validation performance. Notably, problems with sparse data (e.g., Problem 18, 28) show minimal accuracy gains, implying that token quantity alone may not resolve inherent data limitations. This grid underscores the need for problem-specific tokenization strategies to balance accuracy and generalization.