TECHNICAL ASSET FINGERPRINT
cbd06b793900305767a380bf
Click to view fullscreen
Press ESC or click to close
FOUND IN PAPERS
EXPERT: gemini-3-pro VERSION 1
RUNTIME: nugit/gemini/gemini-3-pro-preview
INTEL_VERIFIED
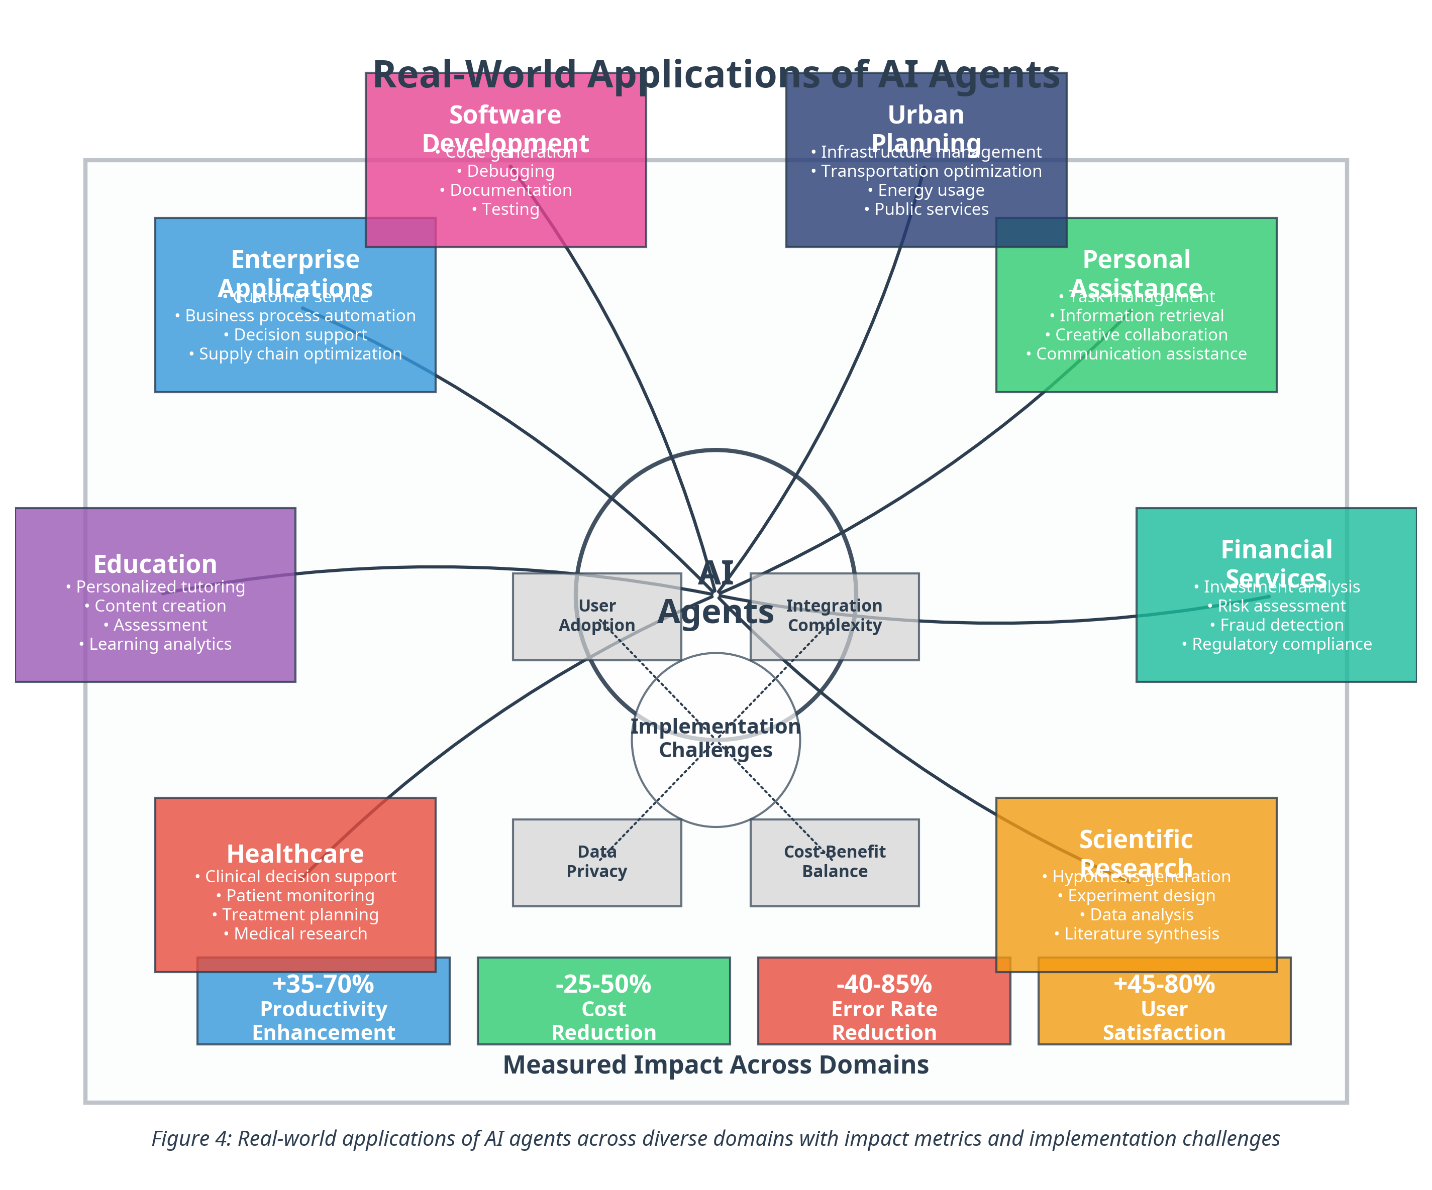
## Diagram: Real-World Applications of AI Agents
### Overview
This image is a complex infographic diagram titled "Real-World Applications of AI Agents." It visually maps the central concept of "AI Agents" to eight distinct industry domains (represented as colored boxes radiating from the center) and four implementation challenges (represented as grey boxes near the center). Additionally, the bottom of the diagram features a section titled "Measured Impact Across Domains" displaying four key performance metrics. The entire diagram is enclosed in a light grey border, and a figure caption is present at the very bottom.
### Components/Structure
**1. Central Hub:**
* **Core Concept:** "AI Agents" is written in the geometric center of the diagram.
* **Visual Metaphor:** A circle surrounds the text "AI Agents," acting as a hub. Lines radiate outward from this hub to connect to the various application domains.
**2. Application Domains (Radiating Boxes):**
There are eight colored rectangular boxes arranged in a circular pattern around the center. Each box represents a sector and lists specific use cases.
* **Top-Left (Pink):** Software Development
* **Top-Right (Dark Blue):** Urban Planning
* **Right-Top (Green):** Personal Assistance
* **Right-Bottom (Teal):** Financial Services
* **Bottom-Right (Orange/Yellow):** Scientific Research
* **Bottom-Left (Red/Coral):** Healthcare
* **Left (Purple):** Education
* **Top-Left (Blue):** Enterprise Applications
**3. Implementation Challenges (Inner Cluster):**
Surrounding the central "AI Agents" text are four grey rectangular boxes labeled "Implementation Challenges." These are connected by dotted lines to a central node labeled "Implementation Challenges."
* **Top-Left:** User Adoption
* **Top-Right:** Integration Complexity
* **Bottom-Left:** Data Privacy
* **Bottom-Right:** Cost-Benefit Balance
**4. Measured Impact Metrics (Bottom Row):**
A row of four colored boxes at the bottom provides quantitative data ranges.
* **Blue Box:** Productivity Enhancement
* **Green Box:** Cost Reduction
* **Red Box:** Error Rate Reduction
* **Yellow/Orange Box:** User Satisfaction
**5. Footer Caption:**
* **Text:** "Figure 4: Real-world applications of AI agents across diverse domains with impact metrics and implementation challenges"
---
### Content Details (Transcription)
#### Application Domains (Clockwise from Top)
1. **Software Development** (Pink Box, Top)
* Code generation
* Debugging
* Documentation
* Testing
2. **Urban Planning** (Dark Blue Box, Top Right)
* Infrastructure management
* Transportation optimization
* Energy usage
* Public services
3. **Personal Assistance** (Green Box, Right)
* Task management
* Information retrieval
* Creative collaboration
* Communication assistance
4. **Financial Services** (Teal Box, Right)
* Investment analysis
* Risk assessment
* Fraud detection
* Regulatory compliance
5. **Scientific Research** (Orange Box, Bottom Right)
* Hypothesis generation
* Experiment design
* Data analysis
* Literature synthesis
6. **Healthcare** (Red Box, Bottom Left)
* Clinical decision support
* Patient monitoring
* Treatment planning
* Medical research
7. **Education** (Purple Box, Left)
* Personalized tutoring
* Content creation
* Assessment
* Learning analytics
8. **Enterprise Applications** (Blue Box, Top Left)
* Customer service
* Business process automation
* Decision support
* Supply chain optimization
#### Implementation Challenges (Central Grey Boxes)
* **User Adoption**
* **Integration Complexity**
* **Data Privacy**
* **Cost-Benefit Balance**
#### Measured Impact Across Domains (Bottom Row Data)
* **+35-70%** Productivity Enhancement
* **-25-50%** Cost Reduction
* **-40-85%** Error Rate Reduction
* **+45-80%** User Satisfaction
---
### Key Observations
* **Symmetry:** The diagram is balanced, with four domains on the upper half and four on the lower half.
* **Connectivity:** Solid black lines connect the central "AI Agents" hub to the outer application domains, indicating a direct relationship. Dotted lines connect the "Implementation Challenges" text to the four specific challenge boxes, indicating a sub-category relationship.
* **Color Coding:** Each domain has a distinct color, likely for visual separation. The impact metrics at the bottom use colors that roughly correspond to positive (Blue/Green/Yellow) and negative/reduction (Red/Green) indicators, though the color choice for "Error Rate Reduction" (Red) is interesting as red usually implies danger, but here it signifies a positive reduction in errors.
* **Overlapping Text:** In the "Urban Planning" box, the text "Infrastructure management" appears slightly garbled or overlapped with the box header. Similarly, in "Personal Assistance," "Task management" is slightly obscured. In "Financial Services," "Investment analysis" is overlapped. In "Scientific Research," "Hypothesis generation" is overlapped. This suggests a rendering issue in the source image.
### Interpretation
This diagram serves as a comprehensive overview of the current state of AI Agent technology. It argues that AI Agents are not limited to a single niche but are a horizontal technology impacting nearly every major sector of the economy.
1. **Breadth of Application:** The diagram demonstrates versatility. From creative tasks (Personal Assistance) to highly regulated technical fields (Healthcare, Finance), AI agents are depicted as having specific, actionable roles (e.g., "Fraud detection" vs. "Creative collaboration").
2. **Balanced Viewpoint:** The inclusion of "Implementation Challenges" in the center suggests a realistic perspective. While the outer ring shows the *potential* and *applications*, the inner ring acknowledges the *barriers* (Privacy, Complexity, Cost, Adoption) that must be overcome to realize that potential.
3. **Quantifiable Value:** The bottom section moves from qualitative descriptions to quantitative claims. The ranges are quite wide (e.g., 35-70% productivity), which implies that results vary significantly by implementation or industry, but the direction of impact is consistently positive (higher productivity/satisfaction, lower costs/errors).
4. **Strategic Focus:** The "Enterprise Applications" and "Software Development" sections highlight the B2B and technical utility of these agents, moving beyond simple consumer chatbots (though "Personal Assistance" covers that).
**Summary:** The diagram is a "Figure 4" from a larger document, likely a white paper or technical report, intended to justify investment in or adoption of AI agents by showcasing their wide utility and measurable positive impact, while transparently acknowledging the hurdles involved.
DECODING INTELLIGENCE...