TECHNICAL ASSET FINGERPRINT
cbd06b793900305767a380bf
Click to view fullscreen
Press ESC or click to close
FOUND IN PAPERS
EXPERT: healer-alpha-free VERSION 1
RUNTIME: free/openrouter/healer-alpha
INTEL_VERIFIED
## Diagram: Real-World Applications of AI Agents
### Overview
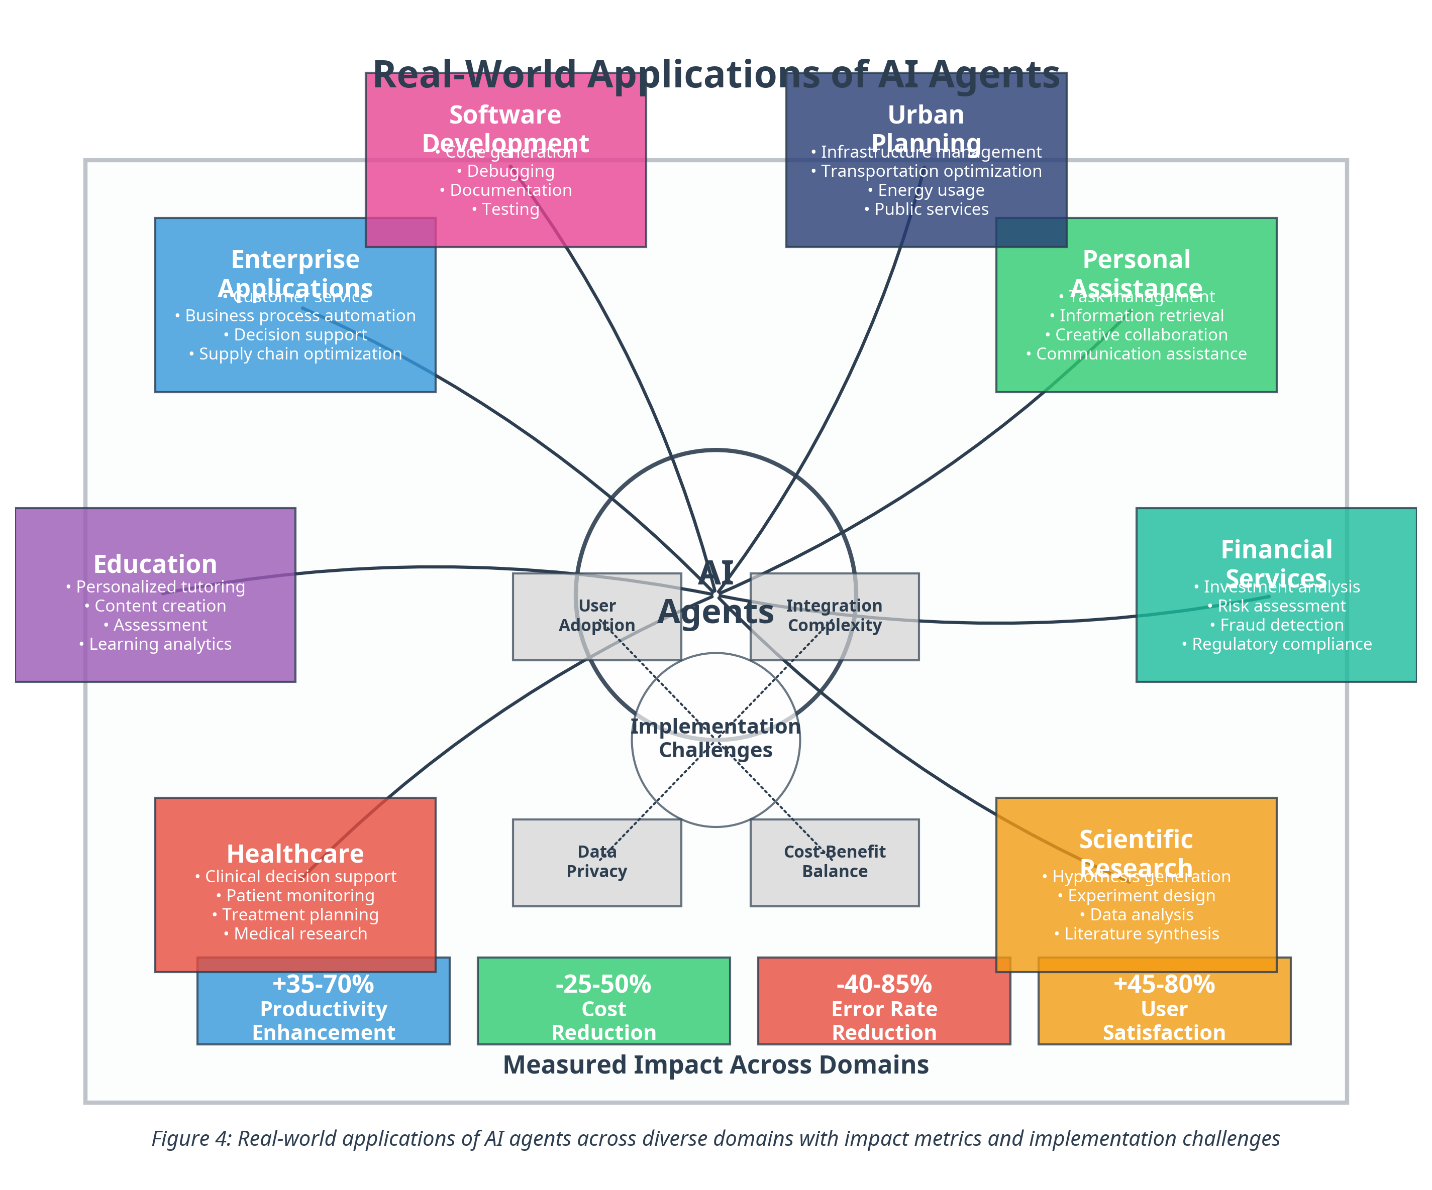
This image is a conceptual diagram illustrating the diverse application domains of AI agents, the core implementation challenges they face, and aggregated impact metrics measured across those domains. The diagram is structured with a central hub, radiating outward to specific sectors, and a separate section at the bottom quantifying overall impact.
### Components/Axes
**Central Hub:**
* **Core Element:** A central circle labeled **"AI Agents"**.
* **Implementation Challenges:** A larger, overlapping circle labeled **"Implementation Challenges"** is connected to the central hub via dotted lines. Within this circle, four key challenges are listed in gray boxes:
* **User Adoption** (top-left of the challenge circle)
* **Integration Complexity** (top-right of the challenge circle)
* **Data Privacy** (bottom-left of the challenge circle)
* **Cost-Benefit Balance** (bottom-right of the challenge circle)
**Radiating Application Domains (connected to "AI Agents" via solid lines):**
The diagram features eight colored boxes, each representing a domain. Each box contains a title and a bulleted list of specific applications.
1. **Software Development** (Pink box, top-left):
* Code generation
* Debugging
* Documentation
* Testing
2. **Urban Planning** (Dark blue box, top-right):
* Infrastructure management
* Transportation optimization
* Energy usage
* Public services
3. **Personal Assistance** (Green box, right):
* Task management
* Information retrieval
* Creative collaboration
* Communication assistance
4. **Financial Services** (Teal box, right):
* Investment analysis
* Risk assessment
* Fraud detection
* Regulatory compliance
5. **Scientific Research** (Orange box, bottom-right):
* Hypothesis generation
* Experiment design
* Data analysis
* Literature synthesis
6. **Healthcare** (Red box, bottom-left):
* Clinical decision support
* Patient monitoring
* Treatment planning
* Medical research
7. **Education** (Purple box, left):
* Personalized tutoring
* Content creation
* Assessment
* Learning analytics
8. **Enterprise Applications** (Blue box, top-left):
* Business process automation
* Decision support
* Supply chain optimization
**Measured Impact Across Domains (Bottom Section):**
A row of four colored boxes summarizes aggregated performance metrics. The title below them reads **"Measured Impact Across Domains"**.
* **Blue Box:** **+35-70% Productivity Enhancement**
* **Green Box:** **-25-50% Cost Reduction**
* **Red Box:** **-40-85% Error Rate Reduction**
* **Orange Box:** **+45-80% User Satisfaction**
**Caption:**
At the very bottom, a figure caption states: *"Figure 4: Real-world applications of AI agents across diverse domains with impact metrics and implementation challenges"*
### Detailed Analysis
The diagram presents a hub-and-spoke model. The central "AI Agents" node is the origin point for eight solid lines, each leading to a distinct application domain. This visually emphasizes that AI agents are a general-purpose technology with specialized implementations.
The "Implementation Challenges" circle overlaps the central hub, indicating these are inherent issues tied directly to the core concept of deploying AI agents. The four challenges (User Adoption, Integration Complexity, Data Privacy, Cost-Benefit Balance) are presented as interconnected facets of a single problem space.
The impact metrics at the bottom are presented as aggregate ranges, suggesting these are generalized findings across the various domains listed above. The color-coding of the impact boxes (Blue, Green, Red, Orange) does not directly correspond to the colors of the domain boxes above them, implying these are summary statistics not broken down per domain in this visual.
### Key Observations
1. **Breadth of Application:** AI agents are shown to be applicable in highly varied fields, from creative tasks (Personal Assistance, Education) to analytical and operational tasks (Financial Services, Software Development, Enterprise Applications).
2. **Common Challenge Themes:** The listed implementation challenges are universal business and technology adoption concerns, not specific to any one domain.
3. **Significant Positive Impact:** All reported impact metrics are strongly positive, showing substantial improvements in efficiency (Productivity, Cost, Error Rate) and user experience (Satisfaction). The wide ranges (e.g., -40-85% Error Rate Reduction) indicate high variability in outcomes, likely dependent on the specific domain and implementation.
4. **Visual Hierarchy:** The diagram prioritizes the *what* (application domains) and the *so what* (impact metrics) over the *how* (specific agent architectures or workflows), which are not detailed.
### Interpretation
This diagram serves as a high-level advocacy and planning tool. It argues that AI agents are a transformative technology with proven, quantifiable benefits across the economic spectrum. The central placement of "AI Agents" with radiating connections suggests they are a foundational capability enabling advancements in disparate fields.
The inclusion of "Implementation Challenges" directly adjacent to the core concept provides a balanced view, acknowledging that realizing these benefits is non-trivial. It frames adoption as a problem of managing user, technical, data, and financial factors.
The "Measured Impact" section provides the business case. The metrics chosen—Productivity, Cost, Error Rate, and Satisfaction—are key performance indicators (KPIs) that resonate with executive and operational decision-makers. The message is clear: investing in AI agent technology yields significant returns across multiple dimensions of performance.
**Notable Anomaly/Omission:** The diagram does not create explicit visual links between specific domains and the impact metrics. For instance, it does not show whether "Healthcare" primarily drives "Error Rate Reduction" or if "Personal Assistance" is the main contributor to "User Satisfaction." This lack of granularity is a limitation for detailed analysis but keeps the diagram focused on the overarching narrative of broad applicability and substantial aggregate benefit.
DECODING INTELLIGENCE...