## Diagram: Real-World Applications of AI Agents
### Overview
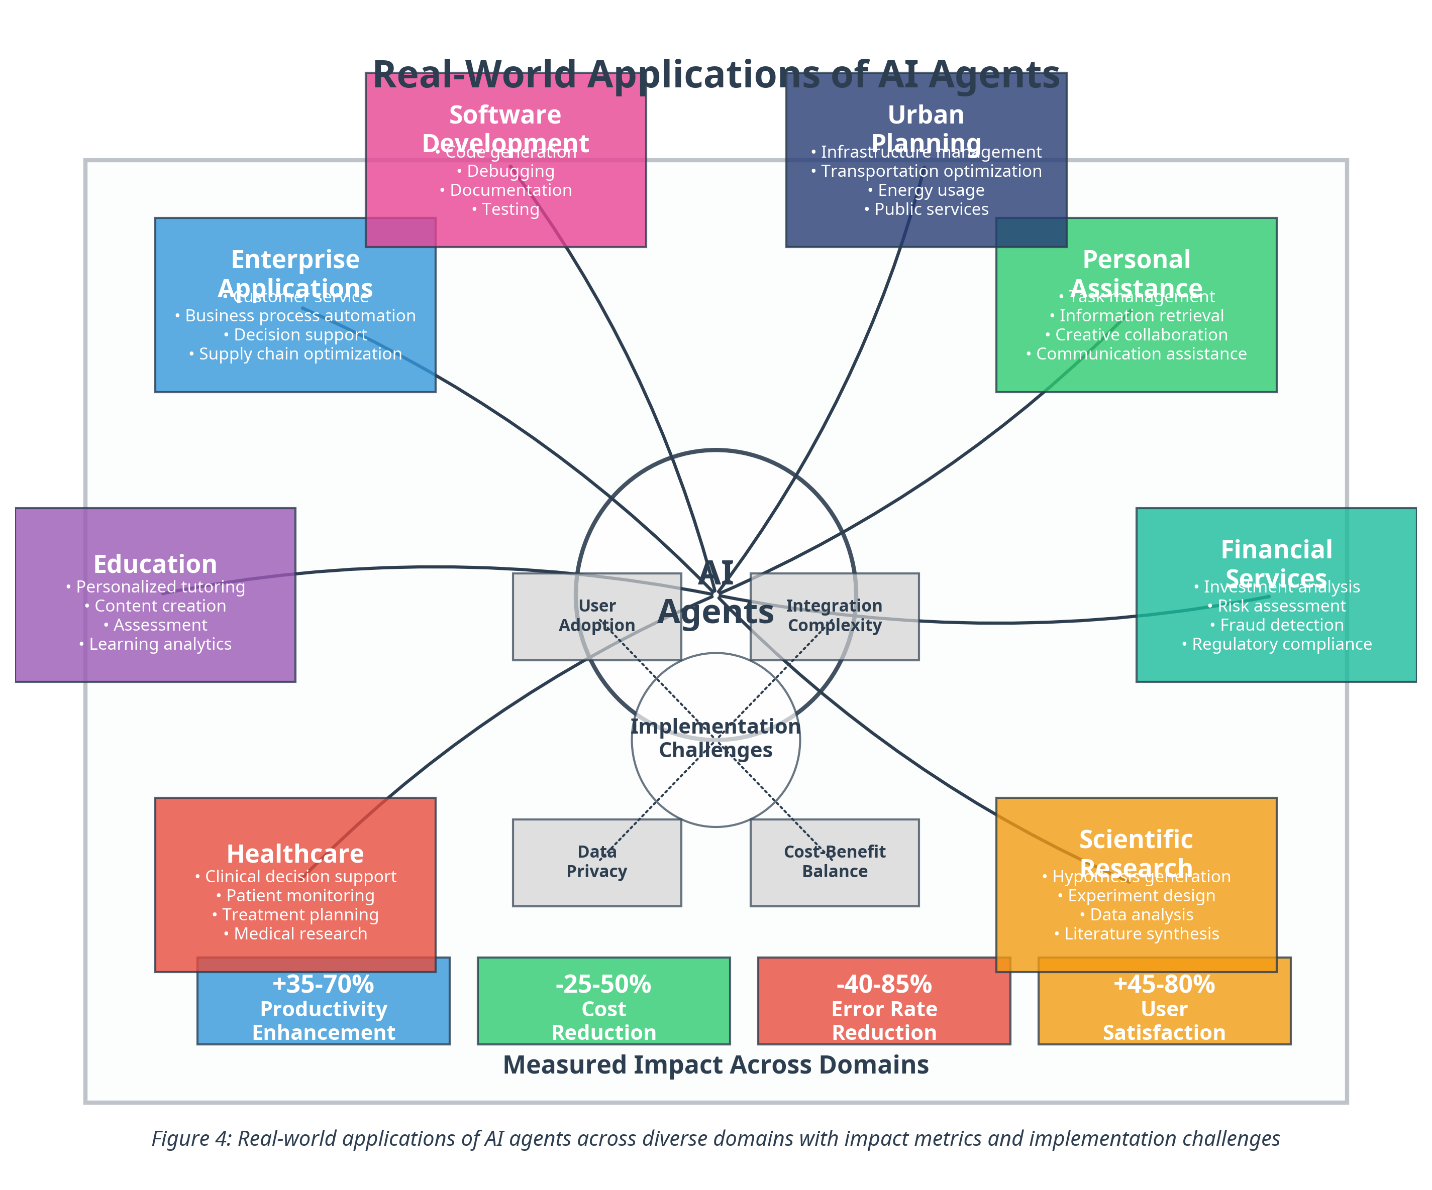
The diagram illustrates the deployment of AI agents across diverse domains, highlighting their applications, implementation challenges, and measurable impacts. Central to the diagram is the "AI Agents" node, connected to eight domains (Healthcare, Education, Financial Services, etc.), each with subcategories and impact metrics. A secondary circle labeled "Implementation Challenges" links to the core node, while a "Measured Impact Across Domains" section quantifies outcomes.
---
### Components/Axes
1. **Central Node**:
- **AI Agents** (black text, central position).
- Connected to eight domains via lines.
2. **Domains**:
- **Healthcare** (red), **Education** (purple), **Financial Services** (teal), **Scientific Research** (orange), **Personal Assistance** (green), **Urban Planning** (dark blue), **Software Development** (pink), **Enterprise Applications** (blue).
- Each domain has 3–4 subcategories (e.g., Healthcare includes "Clinical decision support," "Patient monitoring").
3. **Implementation Challenges** (gray circle):
- **Data Privacy**, **User Adoption**, **Integration Complexity**, **Cost-Benefit Balance**.
- Connected to the central "AI Agents" node.
4. **Measured Impact Across Domains** (bottom section):
- **Productivity Enhancement**: +35–70% (blue).
- **Cost Reduction**: -25–50% (green).
- **Error Rate Reduction**: -40–85% (red).
- **User Satisfaction**: +45–80% (orange).
---
### Detailed Analysis
#### Domains and Subcategories
- **Healthcare** (red):
- Clinical decision support
- Patient monitoring
- Treatment planning
- Medical research
- **Education** (purple):
- Personalized tutoring
- Content creation
- Assessment
- Learning analytics
- **Financial Services** (teal):
- Investment analysis
- Risk assessment
- Fraud detection
- Regulatory compliance
- **Scientific Research** (orange):
- Hypothesis generation
- Experiment design
- Data analysis
- Literature synthesis
- **Personal Assistance** (green):
- Task management
- Information retrieval
- Creative collaboration
- Communication assistance
- **Urban Planning** (dark blue):
- Infrastructure management
- Transportation optimization
- Energy usage
- Public services
- **Software Development** (pink):
- Code generation
- Debugging
- Documentation
- Testing
- **Enterprise Applications** (blue):
- Customer service automation
- Business process automation
- Decision support
- Supply chain optimization
#### Implementation Challenges
- **Data Privacy**: Linked to AI Agents, emphasizing security concerns.
- **User Adoption**: Highlighted as a barrier to widespread implementation.
- **Integration Complexity**: Reflects technical hurdles in adopting AI systems.
- **Cost-Benefit Balance**: Addresses economic feasibility.
#### Measured Impact Metrics
- **Productivity Enhancement**: Highest in Healthcare (+35–70%).
- **Cost Reduction**: Most significant in Financial Services (-25–50%).
- **Error Rate Reduction**: Dominant in Scientific Research (-40–85%).
- **User Satisfaction**: Strongest in Personal Assistance (+45–80%).
---
### Key Observations
1. **High-Impact Domains**:
- Healthcare and Scientific Research show the greatest productivity and error rate improvements.
- Personal Assistance excels in user satisfaction, likely due to intuitive task management.
2. **Challenges**:
- Data Privacy and Integration Complexity are central barriers, affecting all domains.
- User Adoption is a cross-cutting issue, suggesting cultural or technical resistance.
3. **Metric Variability**:
- Productivity and cost metrics are quantified as absolute changes (e.g., +35–70%), while error rates and satisfaction use relative reductions.
---
### Interpretation
The diagram underscores AI agents' transformative potential across sectors, with Healthcare and Scientific Research leading in operational efficiency. However, implementation challenges like Data Privacy and Integration Complexity act as systemic bottlenecks. The emphasis on User Satisfaction in Personal Assistance highlights the importance of human-centric design. Notably, the absence of a "Legends" section in the diagram complicates cross-referencing color-coded data, though the spatial arrangement (e.g., red for Healthcare, orange for Scientific Research) aids intuitive navigation. The quantified impacts suggest AI agents are most effective in automating high-stakes, data-intensive tasks, but their success hinges on resolving technical and ethical challenges.