## Bar Chart: Accuracy and Trial Numbers across Difficulty Level
### Overview
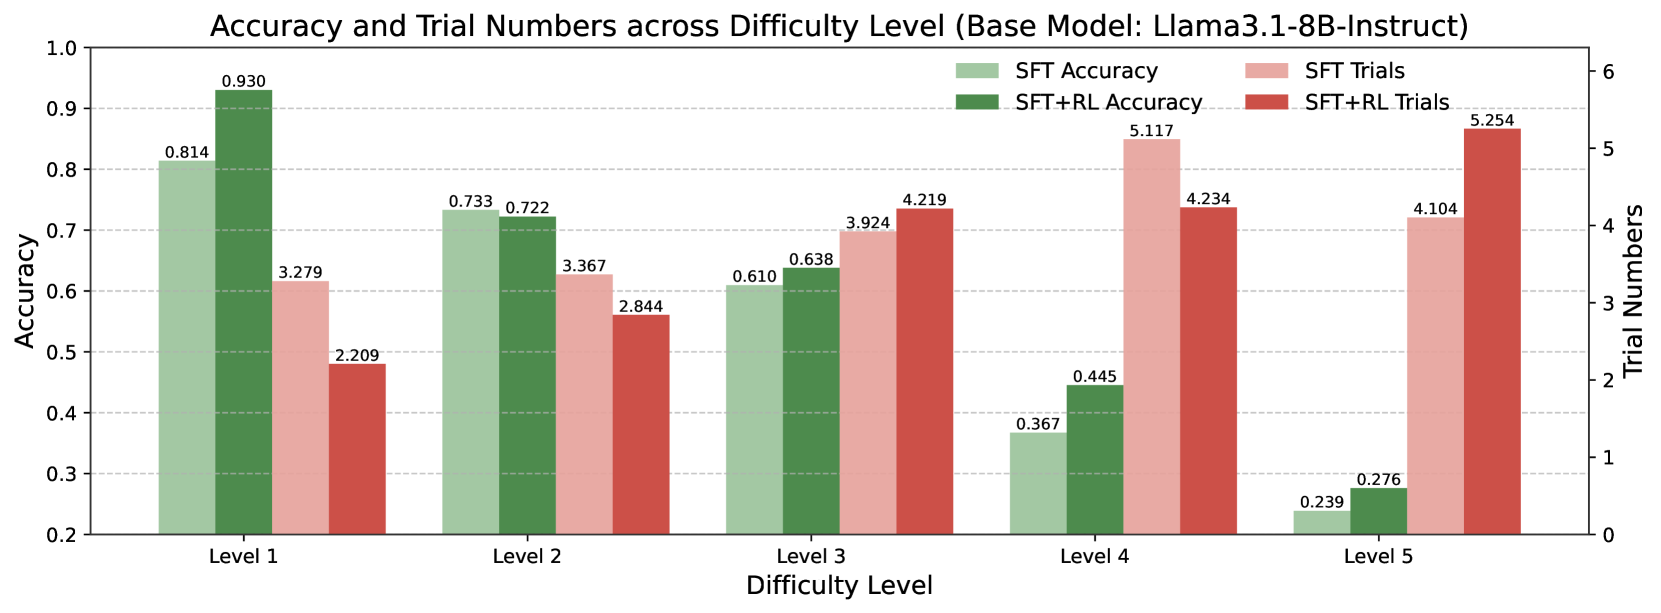
The image is a bar chart comparing the accuracy and trial numbers of a model (Llama3.1-8B-Instruct) across different difficulty levels. The chart displays two accuracy metrics (SFT Accuracy and SFT+RL Accuracy) and two trial number metrics (SFT Trials and SFT+RL Trials) for each difficulty level (Level 1 to Level 5).
### Components/Axes
* **Title:** Accuracy and Trial Numbers across Difficulty Level (Base Model: Llama3.1-8B-Instruct)
* **X-axis:** Difficulty Level (Levels 1, 2, 3, 4, 5)
* **Left Y-axis:** Accuracy (ranging from 0.2 to 1.0, with gridlines at intervals of 0.1)
* **Right Y-axis:** Trial Numbers (ranging from 0 to 6, with gridlines at intervals of 1)
* **Legend:** Located at the top-right of the chart.
* SFT Accuracy (light green)
* SFT+RL Accuracy (dark green)
* SFT Trials (light red)
* SFT+RL Trials (dark red)
### Detailed Analysis
The chart presents four data series across five difficulty levels.
**Accuracy Data Series:**
* **SFT Accuracy (light green):**
* Level 1: 0.814
* Level 2: 0.733
* Level 3: 0.610
* Level 4: 0.367
* Level 5: 0.239
* Trend: Decreasing accuracy as difficulty level increases.
* **SFT+RL Accuracy (dark green):**
* Level 1: 0.930
* Level 2: 0.722
* Level 3: 0.638
* Level 4: 0.445
* Level 5: 0.276
* Trend: Decreasing accuracy as difficulty level increases.
**Trial Numbers Data Series:**
* **SFT Trials (light red):**
* Level 1: 3.279
* Level 2: 3.367
* Level 3: 3.924
* Level 4: 5.117
* Level 5: 4.104
* Trend: Increasing trial numbers from Level 1 to Level 4, then a decrease at Level 5.
* **SFT+RL Trials (dark red):**
* Level 1: 2.209
* Level 2: 2.844
* Level 3: 4.219
* Level 4: 4.234
* Level 5: 5.254
* Trend: Increasing trial numbers as difficulty level increases.
### Key Observations
* Accuracy decreases as the difficulty level increases for both SFT and SFT+RL models.
* Trial numbers generally increase with difficulty level, especially for the SFT+RL model.
* The SFT+RL model consistently shows higher accuracy than the SFT model at Level 1, but the difference diminishes at higher difficulty levels.
* The SFT+RL model requires fewer trials than the SFT model at Level 1 and Level 2, but more trials at Level 3, Level 4, and Level 5.
### Interpretation
The data suggests that the Llama3.1-8B-Instruct model's performance degrades as the difficulty level increases. Reinforcement learning (RL) initially improves accuracy (Level 1), but this advantage diminishes with increasing difficulty. The increasing trial numbers for SFT+RL at higher difficulty levels may indicate that the model requires more attempts to achieve a comparable level of performance to the SFT model, suggesting that the RL component struggles to maintain its effectiveness as the task complexity grows. The model may benefit from further training or adjustments to the RL component to improve its robustness across varying difficulty levels.