## Bar Chart: Accuracy and Trial Numbers across Difficulty Level
### Overview
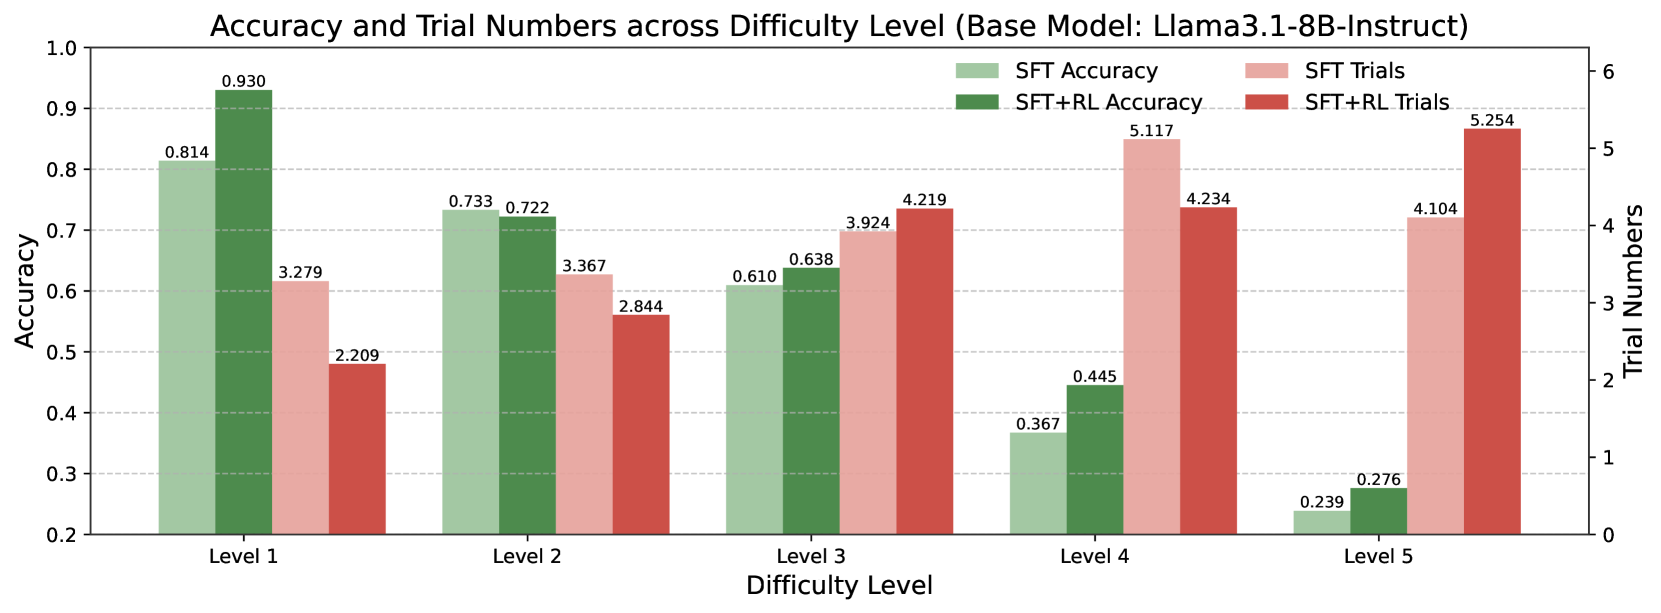
This bar chart compares the accuracy and trial numbers of a model (Llama3.1-8B-Instruct) across five difficulty levels (Level 1 to Level 5). Two training methods are compared: Supervised Fine-Tuning (SFT) and SFT combined with Reinforcement Learning (SFT+RL). Accuracy is represented on the primary y-axis (left), while trial numbers are represented on the secondary y-axis (right).
### Components/Axes
* **Title:** Accuracy and Trial Numbers across Difficulty Level (Base Model: Llama3.1-8B-Instruct) - positioned at the top-center.
* **X-axis:** Difficulty Level - labeled at the bottom, with markers for Level 1, Level 2, Level 3, Level 4, and Level 5.
* **Primary Y-axis (left):** Accuracy - ranging from 0.2 to 1.0.
* **Secondary Y-axis (right):** Trial Numbers - ranging from 0 to 6.
* **Legend:** Located at the top-right.
* SFT Accuracy (Green)
* SFT+RL Accuracy (Dark Green)
* SFT Trials (Red)
* SFT+RL Trials (Dark Red)
### Detailed Analysis
The chart consists of paired bars for each difficulty level, representing accuracy and trial numbers for both SFT and SFT+RL.
**Level 1:**
* SFT Accuracy: Approximately 0.930 (Green bar)
* SFT+RL Accuracy: Approximately 0.814 (Dark Green bar)
* SFT Trials: Approximately 3.279 (Red bar)
* SFT+RL Trials: Approximately 2.209 (Dark Red bar)
**Level 2:**
* SFT Accuracy: Approximately 0.733 (Green bar)
* SFT+RL Accuracy: Approximately 0.722 (Dark Green bar)
* SFT Trials: Approximately 3.367 (Red bar)
* SFT+RL Trials: Approximately 2.844 (Dark Red bar)
**Level 3:**
* SFT Accuracy: Approximately 0.4219 (Green bar)
* SFT+RL Accuracy: Approximately 0.638 (Dark Green bar)
* SFT Trials: Approximately 3.924 (Red bar)
* SFT+RL Trials: Approximately 0.610 (Dark Red bar)
**Level 4:**
* SFT Accuracy: Approximately 0.445 (Green bar)
* SFT+RL Accuracy: Approximately 0.367 (Dark Green bar)
* SFT Trials: Approximately 5.117 (Red bar)
* SFT+RL Trials: Approximately 3 (Dark Red bar)
**Level 5:**
* SFT Accuracy: Approximately 0.276 (Green bar)
* SFT+RL Accuracy: Approximately 0.239 (Dark Green bar)
* SFT Trials: Approximately 4.104 (Red bar)
* SFT+RL Trials: Approximately 5.254 (Dark Red bar)
**Trends:**
* **SFT Accuracy:** Generally decreases as difficulty level increases. Starts high at Level 1 and declines to Level 5.
* **SFT+RL Accuracy:** Shows a more complex trend. It starts lower than SFT at Level 1, but surpasses SFT at Level 3. It then declines at Level 4 and Level 5.
* **SFT Trials:** Generally increases with difficulty level, with a slight dip between Level 2 and Level 3.
* **SFT+RL Trials:** Increases with difficulty level, with a significant increase at Level 5.
### Key Observations
* At Level 1, SFT has significantly higher accuracy than SFT+RL.
* At Level 3, SFT+RL surpasses SFT in accuracy.
* Trial numbers generally increase with difficulty for both methods, suggesting more attempts are needed to achieve results at higher difficulty levels.
* The gap between SFT and SFT+RL trial numbers widens at higher difficulty levels.
### Interpretation
The data suggests that while SFT performs better on easier tasks (Level 1), the addition of Reinforcement Learning (RL) improves performance on more challenging tasks (Level 3). However, this improvement comes at the cost of increased trial numbers, particularly at the highest difficulty levels. This indicates that while RL can enhance the model's ability to solve complex problems, it requires more training iterations. The decreasing accuracy of both methods as difficulty increases highlights the inherent limitations of the model in tackling increasingly complex tasks. The diverging trial numbers suggest that RL may be more sensitive to the difficulty of the task, requiring more exploration and refinement to achieve optimal performance. The chart provides valuable insights into the trade-offs between accuracy, training effort, and difficulty level when choosing between SFT and SFT+RL for this specific model (Llama3.1-8B-Instruct).